
How Much Cash Do You Need?
In this issue:
- Latest in Retirement Savings & Personal Finance: Stocks Most Expensive,Low Number of Job Postings,Naming Your Baby $30K A Pop
- How Much Cash Do You Need?
- Tools & Tips: Emergency Income Checker
- Market Overview
Latest in Retirement Savings & Personal Finance: Stocks Most Expensive, Low Number of Job Postings,Naming Your Baby $30K A Pop
Stocks Most Expensive
Per Bloomberg, US stocks have the highest valuation and are the most expensive in history. Bloomberg’s aggregate stock valuation metric, which uses CAPE, PE, the Buffett Indicator and many others, now surpasses even the highs in 1929 (right before the Great Depression) and 1999 (right before the burst of the technology bubble):

Low Number of Job Postings
Well we all know that the recent weak jobs report has caused the Federal Reserve to cut interest rates. The following chart shows the number of job postings
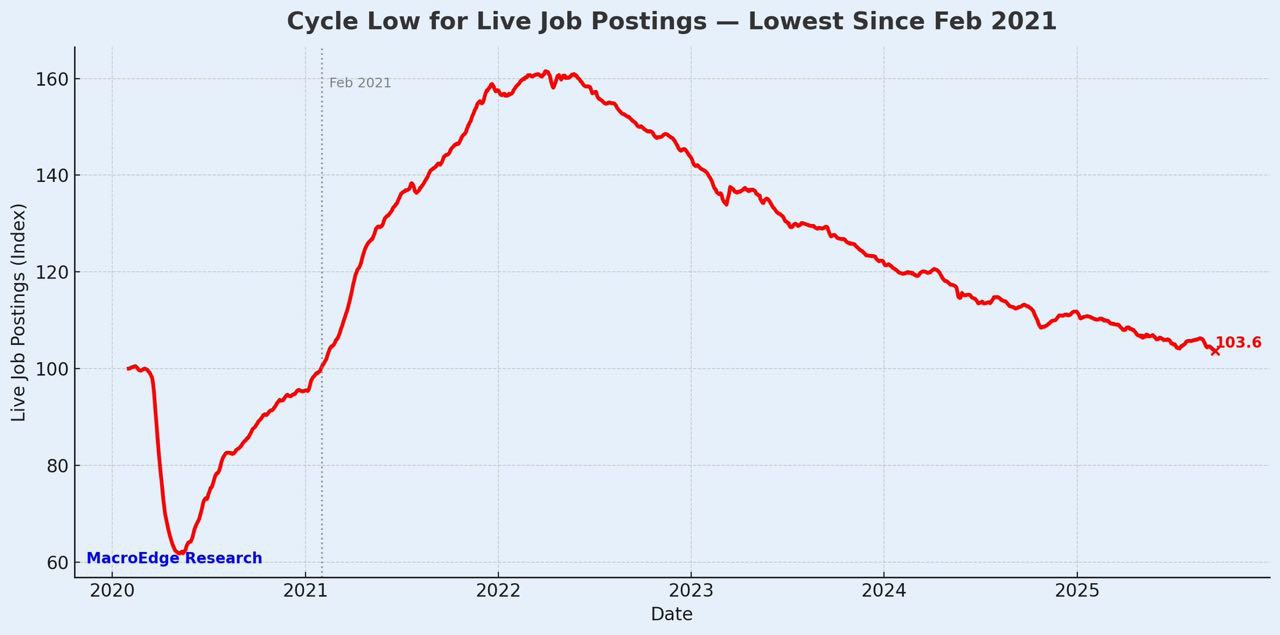
So the number of job postings is about the same as that in February 2021, right out of the worst time of the Covid pandemic.
Naming Your Baby $30K A Pop
Well, doesn’t this signal we are at the epicenter of a bubble?

How Much Cash Do You Need?
Here’s a thing I often ponder: Buffett’s will stipulates that when he’s gone, 90 percent of what goes to his widow should be in a very low-cost S&P 500 index fund, and 10 percent in short-term government bonds (or short-term Treasuries). He says that 10 percent is intended as a buffer “in case there’s a terrible period in the market … she’s withdrawing 3 % or 4 % a year you take it out of that instead of selling stocks at the wrong time.”
Now some might say: wait, his wife is old enough already that “10 percent cash” sounds low: shouldn’t someone in that age bracket hold far more in cash or short-term safe assets? (By the way, Buffett’s current wife is Astrid Menks, born in 1946, so she’s in her late 70s. ) And indeed lots of financial advice for retirees leans conservative: a meaningful safe bucket, cash cushions, lower equity exposure, etc. A common rule of thumb is for retirees to have no more than 30% in stocks.
So this raises two contrasting ways to think about cash / short-term reserves in a retirement / inheritance context:
Approach A: fixed “cash / safe %” as a structural allocation
This is the traditional model: set a percentage for bonds or cash and stick with it. Sometimes it’s expressed as the 100-minus-age rule (often attributed to Bogle’s camp) where your bond share equals your age. At 70, that means 70 % in bonds and only 30 % in equities. Other versions are mostly about the same. For example, our Asset Allocation Calculator would most likely suggest something 20% to 30% or so. The logic: you lower volatility as you age and avoid being forced to sell equities in a downturn. It can feel safer, especially for those without a giant portfolio. But the drawback is that if you live long, your portfolio might not grow enough, and the drag from keeping too much in low-yield assets compounds over decades.
Approach B: “just enough cash to survive the rough patch”
Buffet’s style is more like this. He assumes you’ll have the bulk in equities for growth, but hold enough in short-term safe assets to survive a distressed period (a couple years). If you can ride out drawdowns without tapping equities at the bottom, you avoid crystallizing losses. So the cash bucket is not huge, just big enough to cover your essential withdrawals through a bad stretch (3-4 years, maybe). In his words, you “take out of that instead of selling stocks at the wrong time.” The problem here is that, imagine you are at the third year of a long stretched bear market (the 1929 Great Depression bear market bottomed out in 1932, about 3 years), your stock investments have suffered great losses but now you don’t have any cushion as cash has been mostly depleted.
Both have merit. If you cannot psychologically or financially accept large interim volatility, a larger cash buffer is safer. But if your asset base is big (so that even 10 % is huge in absolute dollars), and you have confidence in the long run, then a more aggressive growth tilt plus a modest survival cushion can work better.
If you want to translate this into your own life, you can use tools like the Emergency Income Checker to estimate how many months or years of “essential spending” you need covered by liquid cash + short-term safe assets. That gives you a more personalized cash target — not just a generic 10 % or 30 % rule.
Tools & Tips: Emergency Income Checker
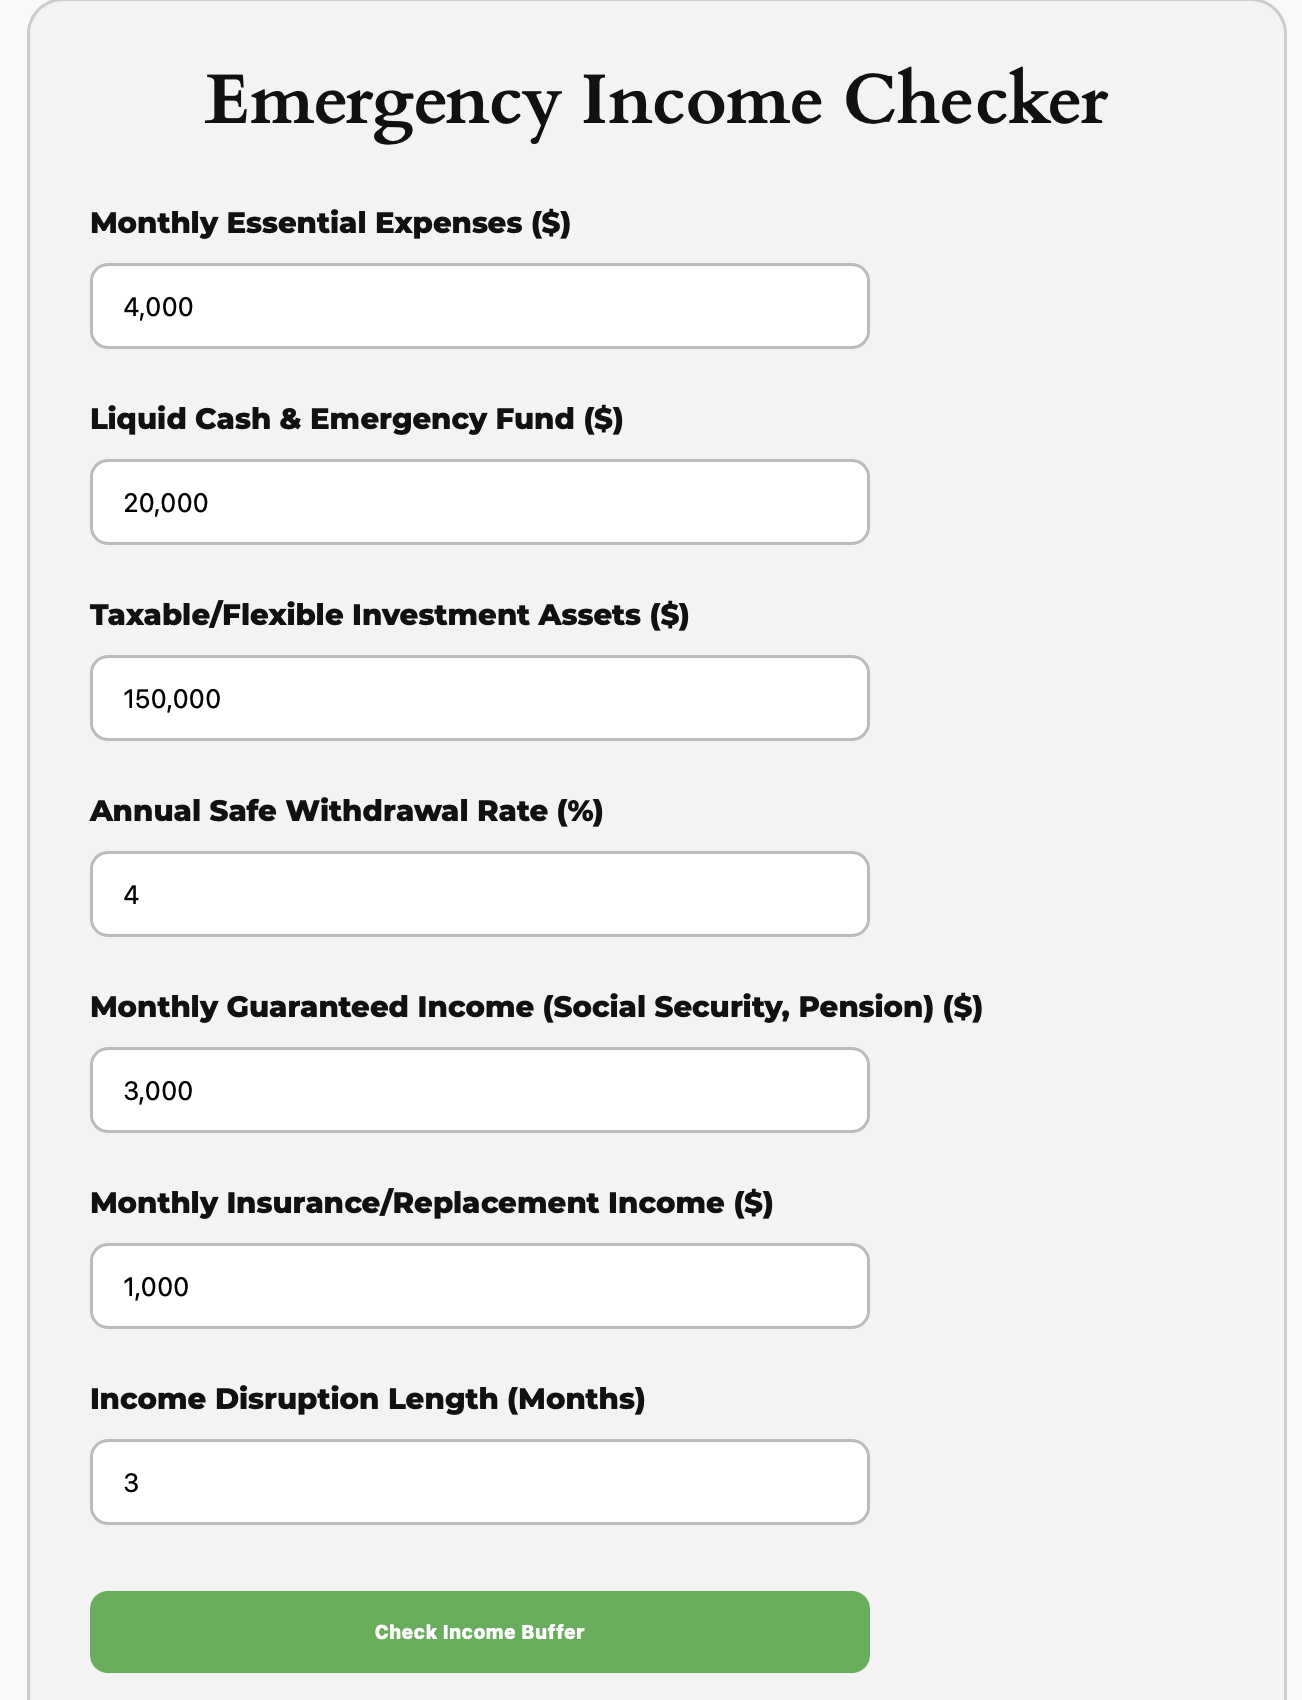
You can use the Emergency Income Checker to stress-test your liquidity plan before an income shock forces you into costly decisions. A short gap or disruption in Social Security or paycheck deposits can derail even well-built budgets, yet a clear snapshot of your cash buffers, flexible investments, and replacement income can close that vulnerability quickly. Plug in your numbers and see down to the month how long you can fund the essentials and how much additional cushion you really need.
Here are the calculator inputs:
And the outputs:
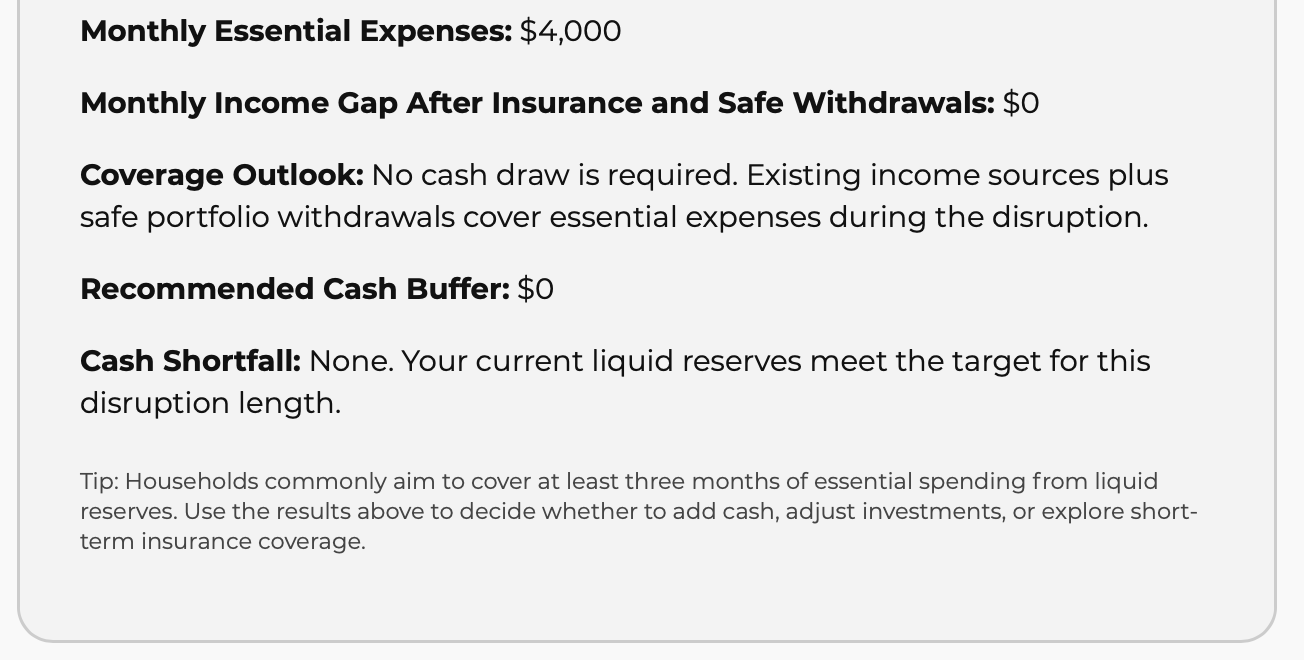
You can, of course, try for a much higher number of months, like 36 months or so. From time to time, especially when markets are in a euphoria state (like right now), it would be prudent to just run this as a sanity check!
Market Overview
Stocks actually reached an all-time high last Monday again. We are leaving September, which has exhibited the ‘worst’ returns on average among the months in a year. However, we are entering October, which has positive stock returns on average but often exhibits high volatility, such as the Black Monday crash in 1987. Just something to consider:

The following table shows the major asset price returns and their trend scores, as of this Monday:
| Asset Class | 1 Weeks | 4 Weeks | 13 Weeks | 26 Weeks | 52 Weeks | Trend Score |
|---|---|---|---|---|---|---|
| US Stocks | -0.7% | 2.9% | 7.4% | 19.1% | 16.6% | 9.1% |
| Foreign Stocks | -0.5% | 3.0% | 6.3% | 19.1% | 16.3% | 8.8% |
| US REITs | -0.6% | -1.2% | 2.3% | 1.5% | -3.8% | -0.4% |
| Emerging Market Stocks | -0.4% | 5.2% | 9.5% | 19.9% | 15.7% | 10.0% |
| Bonds | 0.1% | 0.8% | 1.7% | 3.0% | 2.6% | 1.6% |
More detailed returns and trend scores can be found on MyPlanIQ.com Market Overview.