 |
Vanguard ETF: |  |
7.4%* |
|
Diversified Core: | |
8.1%* |
|
Six Core Asset ETFs: | |
7.3%* |
Articles on DBU
- Schwab Select ETF Plan Has Bright Prospects
04/06/2011
Schwab ETF Plan Has Good Pedigree and Bright Prospects Retirement is now a "hair on fire" problem. There is much talk of working longer, downsizing, living on less. However, there is something you can do to help improve your risk adjusted returns. Look at your portfolios and plans to build a diversified portfolio with a systematic investment strategy.
This is not as hard as you might think -- to highlight this point, we feature a plan created by a non professional that matches up well with any of the other plans. Kevin Carr. is an individual investor who employs a long term strategy. He manages an individual common stock portfolio as well as many plans on MyPlan IQ. If you have any questions regarding this plan please contact him.
This plan provides you with Schwab's experts’ top picks of low-cost ETFs representing approximately 50 ETFs, based on rigorous criteria including expenses, tracking error, trading volume, and more. Schwab ETFs trade commission free. There are no redemption periods so you can start today and not worry about holding periods.We report on this Schwab ETF Select List which consists of 49 funds. These funds give exposure to 6 major assets: US Equity, Commodity, Foreign Equity, REITs, Emerging Market Equity, Fixed Income.
Asset Class Ticker Name LARGE BLEND SCHX Schwab U.S. Large-Cap ETF LARGE GROWTH SCHG Schwab U.S. Large-Cap Growth ETF LARGE VALUE SCHV Schwab U.S. Large-Cap Value ETF MID-CAP BLEND VO Vanguard Mid-Cap ETF Mid-Cap Growth VOT Vanguard Mid-Cap Growth ETF MID-CAP VALUE VOE Vanguard Mid-Cap Value ETF SMALL BLEND SCHA Schwab U.S. Small-Cap ETF Small Growth VBK Vanguard Small Cap Growth ETF SMALL VALUE VBR Vanguard Small Cap Value ETF LARGE BLEND SCHB Schwab U.S. Broad Market ETF LARGE VALUE VYM Vanguard High Dividend Yield Indx ETF Foreign Large Blend SCHF Schwab International Equity ETF Foreign Large Growth EFG iShares MSCI EAFE Growth Index Foreign Large Value EFV iShares MSCI EAFE Value Index FOREIGN SMALL/MID GROWTH SCHC Schwab International Small-Cap Eq ETF DIVERSIFIED EMERGING MKTS SCHE Schwab Emerging Markets Equity ETF Foreign Large Blend VEU Vanguard FTSE All-World ex-US ETF WORLD STOCK VT Vanguard Total World Stock Index ETF EUROPE STOCK VGK Vanguard European ETF DIVERSIFIED PACIFIC/ASIA VPL Vanguard Pacific Stock ETF JAPAN STOCK EWJ iShares MSCI Japan Index China Region GXC SPDR S&P China Intermediate-Term Bond BND Vanguard Total Bond Market ETF SHORT GOVERNMENT SCHO Schwab Short-Term U.S. Treasury ETF Intermediate Government SCHR Schwab Intermediate-Term U.S. Trsy ETF LONG GOVERNMENT TLH iShares Barclays 10-20 Year Treasury Bd Inflation-Protected Bond SCHP Schwab U.S. TIPS ETF Intermediate-Term Bond CIU iShares Barclays Intermediate Credit Bd High Yield Bond JNK SPDR Barclays Capital High Yield Bond WORLD BOND BWX SPDR Barclays Capital Intl Treasury Bond Muni National Long MUB iShares S&P National AMT-Free Muni Bd Consumer Discretionary XLY Consumer Discret Select Sector SPDR Consumer Staples XLP Consumer Staples Select Sector SPDR Equity Energy XLE Energy Select Sector SPDR Financial XLF Financial Select Sector SPDR Health XLV Health Care Select Sector SPDR Industrials XLI Industrial Select Sector SPDR Natural Resources XLB Materials Select Sector SPDR Technology XLK Technology Select Sector SPDR Communications IYZ iShares Dow Jones US Telecom Utilities XLU Utilities Select Sector SPDR COMMODITIES BROAD BASKET DBC PowerShares DB Commodity Index Tracking Commodities Agriculture DBA PowerShares DB Agriculture Commodities Precious Metals IAU iShares Gold Trust Commodities Industrial Metals DBB PowerShares DB Base Metals Commodities Energy USL United States 12 Month Oil MISCELLANEOUS SECTOR PFF iShares S&P U.S. Preferred Stock Index REAL ESTATE VNQ Vanguard REIT Index ETF Asset Class Number of funds Balanced Fund 0 REITs 1 Fixed Income 9 Commodity 5 Sector Fund 11 Foreign Equity 8 Emerging Market Equity 3 US Equity 11 Other 1 Total 49 Many are looking for access to a well rounded ETF plan through Schwab. This fills this hole and as Schwab makes more of their own funds available, it will be possible to move them into the plan. On this review, the only comment would be to add another REIT choice. The other asset classes have a good number of selections without being overwhelming.
As of Apr 4, 2011, this plan investment choice is rated as above average based on MyPlanIQ Plan Rating methodology that was designed to measure how effective a plan's available investment funds are . It has the following detailed ratings:
Diversification -- Rated as great (99%)
Fund Quality -- Rated as average (47%)
Portfolio Building -- Rated as average (56%)
Overall Rating: above average (66%)
Thehigh diversification score means that all the major and minor asset classes have been ticked. Fund quality is lower because some of the ETF's don't have a long history but that shouldn't impede the ability for the future.
Portfolio Discussions
The chart and table below show the historical performance of moderate model portfolios employing strategic and tactical asset allocation strategies. For comparison purpose, we also include the moderate model portfolios of a typical 6 asset SIB (Simpler Is Better) plan . This SIB plan has the following candidate index funds and their ETFs equivalent:
US Equity: SPY or VTI
Commodity: DBC
Foreign Equity: EFA or VEU
REITs: IYR or VNQ or ICF
Emerging Market Equity: EEM or VWO
Fixed Income: AGG or BND
Performance chart (as of Apr 4, 2011)Performance table (as of Apr 4, 2011)
Portfolio Name 1Yr AR 1Yr Sharpe 3Yr AR 3Yr Sharpe 5Yr AR 5Yr Sharpe Schwab ETF Select List Tactical Asset Allocation Moderate 9% 82% 8% 72% 12% 89% Schwab ETF Select List Strategic Asset Allocation Moderate 14% 118% 3% 15% 4% 20% Six Core Asset ETF Benchmark Tactical Asset Allocation Moderate 9% 81% 10% 82% 13% 89% Six Core Asset ETF Benchmark Strategic Asset Allocation Moderate 14% 121% 4% 20% 7% 34%
This portfolio performs well against the six asset ETF benchmark- SAA provides lower volatility while albeit delivering lower historical returns but as more of the newer funds are applied to the portfolio, there will be more opportunity for closing the gap
- The TAA portfolios run neck and neck over the five year period
In a future article, we will review performance over the last three months to see how the plan has performed in the light of recent events.
Kay Takeaways- Building a plan of funds is not the preserve of the few -- anybody who has the interest and application to research can provide well constructed plans
- It is possible to benefit from those individuals while still having transparency and not being captive to any particular broker
Symbols: SPY, VTI, EFA, VEU, EEM, VWO, IYR, VNQ, ICF, AGG, BND, DBC, HYG, JNK, PHB, CIU, BIV, MUB, TFI, PZA, MLN, GII, PUI, DBU, RYU, UPW, IYH, IXJ, VHT, XBI, PBE, DBR, RYH, EFG, IXP, PTE, DGG, LTL, IYM, IGE, VAW, XLB, XME, PYZ, DBN, RTM, UYM, MTK, PTF, DBT, RYT, ROM, GWL, PFA, IVE, IWW, JKF, VTV, ELV, PWV, RPV, SCHV, EFV, PID, DWM, IYF, VFH, IPF, PFI, DRF, RYF, KXI, VDC, PSL, DPN, RHS, RXI, VCR, IYJ, EXI, VIS, IGOV, BWX, WIP, IVV, IYY, IWV, VV, DLN, RSP, SCHX, IOO, VT, SHY, SHV, VGSH, PLK, USY, TLT, TLH, IEF, EDV, VGLT, TLO, PLW, IEV, VGK, PEF, DEB, IVW, IWZ, JKE, VUG, ELG, QQQQ, RPG, SCHG, IJJ, IWS, JKI, VOE, EMV, PWP, RFV, UVU, IJH, IWR, JKG, VO, MDY, EMM, PJG, DON, EZM, MVV, IFSM, VSS, SCHC, IJS, IWN, JKL, VBR, DSV, PWY, RZV, UVT, IJR, IWM, JKJ, VB, DSC, PJM, DES, SAA, UWM, SCHA, GMM, PXH, DEM, SCHE, ITE, IXC, IPW, DBE, RYE, DKA, IEI, VGIT, IJK, IWP, VOT, EMG, PWJ, RFG, UKW, IJT, IWO, JKK, VBK, DSG, PWT, RZG, UKK, TIP, EPP, VPL, GMF, PAF, EWJ, JPP, PJO, DXJ, GSG
Disclosure:
MyPlanIQ does not have any business relationship with the company or companies mentioned in this article. It does not set up their retirement plans. The performance data of portfolios mentioned above are obtained through historical simulation and are hypothetical.
- Vanguard VA Has Some Rules and Can Be Cloned with an ETF Portfolio
12/08/2010
In a previous article noted that Variable Annuities have well chosen sub account funds that can lead to a portfolio that can deliver good returns. We now examine the Vanguard Variable Annuity and see how well an ETF clone performs
The Vanguard Variable Annuity consists of 15 funds. These funds enable participants to gain exposure to 4 major assets: US Equity, Foreign Equity, REITs, Fixed Income.As of Dec 3, 2010, this plan investment choice is rated as above average based on MyPlanIQ Plan Rating methodology that was designed to measure how effective a plan's available investment funds are . It has the following detailed ratings:
Diversification -- Rated as above average (83%)
Fund Quality -- Rated as average (64%)
Portfolio Building -- Rated as above average (75%)
Overall Rating: above average (74%)Asset Class
Vanguard Schwab Fidelity
US
8 35 13
International
1 5 5
Sector
0 3 12
Balanced
1 2 8
Fixed income
4 9 7
Emerging Markets
0 1 3
Real estate
1 1 1
Target Date
0 0 7
Compared to Schwab and Fidelity, the number of fund choices are significantly fewer leading to greater stress on the fund quality. This has a lower rating than the other two and so we would expect the returns to be lower.
We also note that the Vanguard annuity has additional restrictions. They limit the trading on any one fund to two sell-buy trips in a year. With the smaller number of funds, this could be a significant restriction.The chart and table below show the historical performance of moderate model portfolios employing strategic and tactical asset allocation strategies ( SAA andTAA , both provided by MyPlanIQ). For comparison purpose, we also include the moderate model portfolios of a typical 4 asset SIB (Simpler Is Better) plan . This SIB plan has the following candidate index funds and their ETFs equivalent:
US Equity: SPY or VTI
Foreign Equity: EFA or VEU
REITs: IYR or VNQ or ICF
Fixed Income: AGG or BND
Performance chart (as of Dec 3, 2010)Performance table (as of Dec 3, 2010)
Portfolio Name 1Yr AR 1Yr Sharpe 3Yr AR 3Yr Sharpe 5Yr AR 5Yr Sharpe Vanguard Variable Annuity Tactical Asset Allocation Moderate 13% 91% 10% 92% 12% 106% Vanguard Variable Annuity Strategic Asset Allocation Moderate 11% 120% 2% 7% 4% 22% Four Core Asset Index Funds REITs Tactical Asset Allocation Moderate 8% 62% 6% 55% 9% 80% Four Core Asset Index Funds REITs Strategic Asset Allocation Moderate 12% 94% 2% 7% 5% 20%
The annuity performs well against our benchmark -- indicating a good choice of fundsWe are now going to build a clone plan and see how it performs. We will simplify the choice and not duplicate styles.
US FundsStyle Fidelity ETF LARGE BLEND
VDEQX VLISX VTSMX
VTI
LARGE GROWTH
VHCAX VIGAX
VUG
LARGE VALUE
VEIPX
VTV
MID-CAP BLEND
VIMSX
VO
The US funds choice is very wide. There are probably too many choices in this category and it would be better to have more choices in other asset classes.
We will not mirror all the choices with the ETF clone just one ETF in each style category.
International FundsStyle Fidelity ETF Foreign Large Growth
VGTSX
EFA
It would have been better to have some mid or small cap alternatives but still a good amount of choice.
We will match one style in each category in the international asset class.
Real EstateStyles Fidelity ETF REAL ESTATE
VGSIX
IYR, RWX
Real estate is under represented -- an international REIT would strengthen this asset class.
We add an international REIT Fund to the ETF's.
Fixed IncomeStyle Fidelity ETF High Yield Bond
VWEAX
HYG
Intermediate-Term Bond
VBMFX
BND Cash
CASH
CASH Short-Term Bond
VFSTX
SHY
The fixed income class is well balanced with good choices and diversification.
We match this with the exception of having a second intermediate term bond. We add an emerging markets bond to offset this.
We now compare the returns of the two plans using tactical and asset allocation strategies with a moderate risk portfolio.Strategic Asset Allocation 1Yr
AR1Yr Sharpe 3Yr
AR3Yr Sharpe 5Yr
AR5Yr Sharpe Strategic Asset Allocation Growth Customize 14% 96% 1% 1% 6% 22% Strategic Asset Allocation Moderate Customize 12% 105% 1% 6% 5% 26% Strategic Asset Allocation Conservative Customize 9% 119% 2% 16% 5% 35%
Tactical Asset Allocation 1Yr
AR1Yr Sharpe 3Yr
AR3Yr Sharpe 5Yr
AR5Yr Sharpe Tactical Asset Allocation Growth Customize 10% 64% 6% 44% 10% 70% Tactical Asset Allocation Moderate Customize 8% 64% 5% 48% 8% 75% Tactical Asset Allocation Conservative Customize 6% 81% 4% 61% 7% 86%
The Variable Annuity Portfolios have a clear lead over its ETF clone. The reason for this is the larger number of funds to allow styles rotation. One important note is that the returns are before fees are assessed. Variable annuities are complex instruments with fees that can be in excess of 2% of the asset base per year. Even so, the historical returns are good and there is the benefit that gains are not taxed.
Looking at the fund design for Variable Annuities can be instructive to allow you to build a plan that enables portfolios that give you good risk adjusted returns.
labels:investment,
Symbols:AGG,AOK,AOM,BIV,BND,BSV,CIU,CSJ,DBC,DBE,DBN,DBR,DBT,DBU,DEM,DES,DGG,DKA,DLN,DON,DPN,DRF,DSC,DWM,EEM,EFA,EFG,EFV,ELG,ELV,EMG,EMM,EMV,EXI,EZM,GBF,GII,GMM,GWL,HYG,ICF,IGE,IJH,IJJ,IJK,IJR,IOO,IP,IPF,IPW,ITE,IVE,IVV,IVW,IWM,IWP,IWR,IWS,IWV,IWW,IWZ,IXC,IXJ,IXP, ,
- ETF Cloning of the Schwab VA
11/30/2010
In a previous article noted that Variable Annuities have well chosen sub account funds that can lead to a portfolio that can deliver good returns. We now examine the Schwab Select Annuity, compare it with the Fidelity Personal Retirement Annuity and see how well an ETF clone performs
In Summary, the Fidelity Personal Retirement Annuity's plan consists of 56 funds. These funds enable participants to gain exposure to 5 major assets: US Equity, Foreign Equity, REITs, Emerging Market Equity and Fixed Income.Asset Class
Schwab Fidelity
US
35 13
International
5 5
Sector
3 12
Balanced
2 8
Fixed income
9 7
Emerging Markets
1 3
Real estate
1 1
Target Date
0 7
We are now going to build a clone plan and see how it performs. We will simplify the choice and not duplicate styles.
US FundsStyle Fidelity ETF LARGE BLEND
DGAGX KBCAX PIODX PJIAX SICWX SWHGX SWPPX
VTI
LARGE GROWTH
AAGOX JGIIX NMTBX SDGAX
VUG
LARGE VALUE
ACGMX ACSDX AVLIX KDCAX MEIIX
VTV
MID-CAP BLEND
GMCBX GTAVX RMVSX SOPVX
VO
Mid-Cap Growth
AMGOX BGRFX DFCIX TEGAX
IJK
Mid-Cap Growth
FMCCX
MID-CAP VALUE
ABASX
AVUA
IPVIXIJJ
SMALL BLEND
KDSAX
SMEIXVB
Small Growth PGOFX SIGWX SSDAX VBK Small Value CSSBX DEVLX FBVAX VBR
The US funds choice is very wide and here we will not mirror all the choices just one in each style category.
International FundsStyle Fidelity ETF World Stock
JWGRX
EFA
World Stock
OGLYX
VT
Similarly we will match one style in each category in the international asset class.
Emerging marketsStyle Fidelity ETF Emerging Markets
LZEMX
EEM
We select two emerging market ETF's to provide an alternative style.
Real EstateStyles Fidelity ETF REAL ESTATE
IYR
IYR, RWX
Real estate is under represented -- an international REIT would strengthen this asset class. We will add an international REIT Fund to the ETF's.
Fixed IncomeStyle Fidelity ETF Emerging Markets Bond
MSIEX
EMB
High Yield Bond
FHNIX
HYG
Inflation-Protected Bond
PRRIX
TIP
Intermediate-Term Bond
FBNDX
BND Intermediate-Term Bond
PTTRX
Cash
CASH
CASH Short-Term Bond
PTLDX
SHY
The fixed income class is well balanced with good choices and diversification. We match this with the exception of having a second intermediate term bond.
We are not attempting to match any of the balanced funds as there is no opportunity to use these in a standalone portfolio. While the managed funds are available, the fee structure is such that the returns are going to leak into other people's pockets and it will pay you to be on top of your own investments -- either directly or through a professional.
We now compare the returns of the two plans using tactical and asset allocation strategies with a moderate risk portfolio.Performance chart (as of Nov 19, 2010)
Performance table (as of Nov 19, 2010)
Portfolio Name 1Yr AR 1Yr Sharpe 3Yr AR 3Yr Sharpe 5Yr AR 5Yr Sharpe Fidelity Personal Retirement Annuity Tactical Asset Allocation Moderate 16% 113% 9% 78% 15% 115% Fidelity Personal Retirement Annuity Strategic Asset Allocation Moderate 15% 130% 4% 20% 7% 42% Fidelity-VA-Clone Tactical Asset Allocation Moderate 10% 69% 7% 58% 10% 75% Fidelity-VA-Clone Strategic Asset Allocation Moderate 12% 103% 1% 2% 5% 22%
The Variable Annuity Portfolios have a clear lead over its ETF clone. The reason for this is the larger number of funds to allow styles rotation.
In fact, to get similar performance using ETF's, you would need to go to one of the richest plans -- provided by TD Ameritrade. The comparison is below.Performance chart (as of Nov 19, 2010)
Performance table (as of Nov 19, 2010)
Portfolio Name 1Yr AR 1Yr Sharpe 3Yr AR 3Yr Sharpe 5Yr AR 5Yr Sharpe Fidelity Personal Retirement Annuity Tactical Asset Allocation Moderate 16% 113% 9% 78% 15% 115% Fidelity Personal Retirement Annuity Strategic Asset Allocation Moderate 15% 130% 4% 20% 7% 42% TD Ameritrade Commission Free ETFs Tactical Asset Allocation Moderate 11% 77% 12% 78% 19% 117% TD Ameritrade Commission Free ETFs Strategic Asset Allocation Moderate 8% 74% -0% -5% 7% 37%
One important note is that the returns are before fees are assessed. Variable annuities are complex instruments with fees that can be in excess of 2% of the asset base per year. Even so, the historical returns are good and there is the benefit that gains are not taxed.
Looking at the fund design for Variable Annuities can be instructive to allow you to build a plan that enables portfolios that give you good risk adjusted returns.labels:investment,
Symbols:AGG,AOK,AOM,BIV,BND,BSV,CIU,CSJ,DBC,DBE,DBN,DBR,DBT,DBU,DEM,DES,DGG,DKA,DLN,DON,DPN,DRF,DSC,DWM,EEM,EFA,EFG,EFV,ELG,ELV,EMG,EMM,EMV,EXI,EZM,GBF,GII,GMM,GWL,HYG,ICF,IGE,IJH,IJJ,IJK,IJR,IOO,IP,IPF,IPW,ITE,IVE,IVV,IVW,IWM,IWP,IWR,IWS,IWV,IWW,IWZ,IXC,IXJ,IXP,
- Can we Beat Morningstar Bond Managers with ETF's
11/26/2010
In a previous article we questioned conventional wisdom that risk based assets as the main engine of portfolio growth. We presented a simple investment strategy -- pick the top seven bond managers and own the top performing bond fund which you review on a monthly basis (or quarterly if you prefer).
Currently, the top seven are:Bond Fund
Ticker
PIMCO Total Return
TCW Total Return Bond
Western Asset Core Bond
Metropolitan West Total Return Bond
Loomis Sayles Bond
Dodge & Cox Income
FPA New Income
In this article, we examine other bond only plans and see if the results can compete.
There are two other portfolios we present.
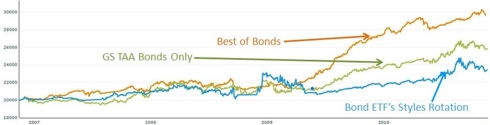
Goldman Sachs Global Tactical Asset Allocation:This is a cross-asset (or multi-asset) momentum based tactical asset allocation. This is based on a published report by Goldman Sachs on some of their funds. This is a simplified interpretation of strategies proposed by Goldman Sachs on Global Tactical Asset Allocation. The original strategy is based on the following:- Among six asset classes: US equity (represented by ETF S&P 500 Spider SPY), International equity (represented by MSCI ETF EFA), Real Estate (represented by NAREI ETF IYR), Commodities (represented by Goldman Sachs commodity index ETF GSG), US aggregate bond (represented by ETF AGG), cash, simply calculate the previous 12 month return at year end.
- Rank the year end returns among these 6 assets.
- Choose the top 3 assets and invest these top 3 assets for the next year in equal money amount.
We have modified this by removing all the risk based assets and replaced the aggregate bonds with US long term treasury bond fund. In addition, any asset has to have the score higher than CASH to qualify for the purchase.
This allows the best bond funds to be selected based on their momentum.
TDA Ameritrade's Commission Free ETFs
We recently reviewed their plan with over 100 commission free ETFs. We use this plan but drove the strategy to select only bond funds using MyPlanIQ's tactical asset allocation.
Given that some of the ETFs don't have a long history, we only went back to 2007. It is possible to see the impact of the strategies b
 Portfolio Performance Comparison
Portfolio Name 1Yr AR 1Yr Sharpe 3Yr AR 3Yr Sharpe 5Yr AR 5Yr Sharpe Best of Bonds (BoB) 9% 194% 12% 199% 11% 165% Bond ETFs 8% 86% 4% 38% 4% 33% Gold-Sachs-Bonds-TAA 9% 123% 7% 88% 6% 68%
Click for full details
Looking over a five year horizon, it is clear that BoB delivers the best results by quite a margin. In the shorter term, the results are much closer and as more fixed income ETF's become established and liquid, it will be worth watching and paying a return visit to look at returns in the future.
For now, the simplicity of the approach and the strength of the results leave BoB out in front. In this case, actively managed funds appear to beat the index funds.labels:investment,
Symbols:SPY,VTI,EFA,VEU,EEM,VWO,IYR,VNQ,ICF,AGG,BND,HYG,JNK,PHB,CIU,BIV,GII,PUI,DBU,RYU,UPW,IYH,IXJ,VHT,XBI,PBE,DBR,RYH,IXP,PTE,DGG,LTL,IYM,IGE,VAW,XLB,XME,PYZ,DBN,RTM,UYM,MTK,PTF,DBT,RYT,ROM,GWL,PFA,IVE,IWW,JKF,VTV,ELV,PWV,RPV,SCHV,IYF,VFH,IPF,PFI,DRF,RYF,KXI,
- Top Tier ETF Broker Finalists
10/28/2010
We have examined four ETF Providers, Schwab, Ameritrade, Vanguard and Fidelity.
Schwab and Fidelity were removed from the list as Ameritrade and Vanguard both had more asset classes and more funds with which to build a portfolio generating higher returns.
Ameritrade with 101 funds and Vanguard with 62 funds are left with the ability to go into deeper analysis to see whether the extra funds in Ameritrade deliver added value.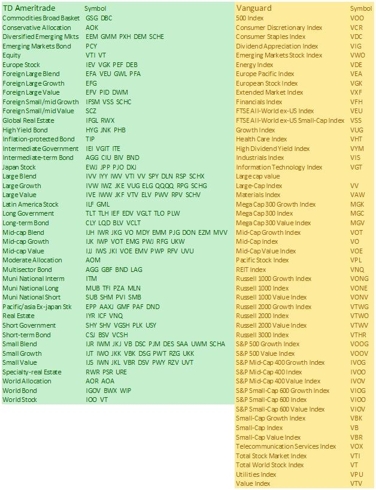
TD Ameritrade have multiple ETF's in each minor asset category whereas Vanguard does not. Both brokers offer a very broad range of US equities
Performance chart (as of Oct 25, 2010)Performance table (as of Oct 25, 2010)
Portfolio Name 1Yr AR 1Yr Sharpe 3Yr AR 3Yr Sharpe 5Yr AR 5Yr Sharpe Vanguard 62 Tactical Asset Allocation Moderate 14% 93% 5% 33% 13% 81% Vanguard 62 Strategic Asset Allocation Moderate 17% 126% 2% 5% 8% 42% TD Ameritrade Commission Free ETFs Tactical Asset Allocation Moderate 14% 96% 13% 84% 20% 128% TD Ameritrade Commission Free ETFs Strategic Asset Allocation Moderate 10% 89% -1% -10% 8% 44% labels:investment,
Symbols:SPY,VTI,EFA,VEU,EEM,VWO,IYR,VNQ,ICF,AGG,BND,HYG,JNK,PHB,CIU,BIV,GII,PUI,DBU,RYU,UPW,IYH,IXJ,VHT,XBI,PBE,DBR,RYH,IXP,PTE,DGG,LTL,IYM,IGE,VAW,XLB,XME,PYZ,DBN,RTM,UYM,MTK,PTF,DBT,RYT,ROM,GWL,PFA,IVE,IWW,JKF,VTV,ELV,PWV,RPV,SCHV,IYF,VFH,IPF,PFI,DRF,RYF,KXI,
- Top Tier ETF Broker Playoffs II
10/26/2010

