In this issue:
- Growth vs. Value: Late Stage and Early Stage of a Bull Market
- Fund Analysis: CLO Bond Funds
- Economic & Market Indicators
- Model Portfolios
- Funds to Watch
- Market Overview
Growth vs. Value: Late Stage and Early Stage of a Bull Market |
As we are amid one of the longest secular bull markets, during which growth stocks have outperformed value stocks for an extended period (10 years and counting), we are increasingly seeing signs of a possible severe downturn. Although it may still be early to prepare for the eventual bear market, it is important to understand how the two most significant stock styles—growth and value—behave across various market cycles.
In the following study, we present evidence and supporting data for the thesis that
Value stocks tend to shine in the early bull-market phase, whereas growth stocks dominate as the cycle matures.
Let’s delve into the details of this study.
Bull Market Definitions and Identification
A bull market here is defined as the period between a major stock market trough and the subsequent peak (a gain of 20% or more without a 20% decline in between). We further break each bull market into two phases: an early-stage (the first 12 months after the bear-market trough) and a late-stage (the final 12 months leading up to the next bear-market peak). For example, the S&P 500’s trough in March 2009 began a bull market that ran until February 2020 The first year (April 2009–March 2010) is the early stage, and the last three years (March 2017–Feb 2020) are the late stage.
The following table lists the major U.S. bull markets since World War II with their early and late sub-periods and the corresponding performance of value and growth stocks. (Bull market dates are based on S&P 500 cycles. NBER recession dates were cross-checked to confirm that many bull markets start in post-recession recovery periods and end near the next recession.)
Fama-French HML as Value–Growth Proxy
To quantify style performance, we use Fama–French’s High-Minus-Low (HML) factor—the return premium of high book-to-market “value” stocks over low book-to-market “growth” stocks. It is straightforward to define ‘value’ stocks as those with High book-to-market (price) ratios. However, defining ‘growth’ stocks is less clear, as a Low book-to-market ratio is just one of many possible criteria. Intuitively, a low book-to-market ratio means the stock price is relatively high compared to its book value, effectively indicating expensive stocks. Nonetheless, we use this as a proxy for the definition of ‘growth.’
A positive HML indicates that value stocks outperform growth stocks, while a negative HML means growth stocks are outperforming. We obtained monthly HML data from July 1926 onward from the Fama–French data library to cover as many historical cycles as possible. This allows us to compute value and growth returns (approximated by the HML differential) for each bull-market stage.
Early vs. Late Bull Market Performance
Historical data strongly support the thesis that value stocks tend to lead during early bull markets, while growth stocks dominate in late-stage bulls. In the initial recovery from a bear-market bottom, economically sensitive “value”stocks (often cyclical sectors like financials, industrials, energy) rebound sharply as conditions improve and valuations are extremely compressed. By contrast, in the final years of a prolonged bull, investor enthusiasm often shifts to “growth” stocks with high earnings potential, driving their valuations to peaks (as seen in episodes like the late-1990s tech bubble and the late-2010s FAANG rally).
Value vs. Growth Returns by Bull-Market Stage: The table below summarizes value and growth performance in each bull market’s early, intermediate, and final stages. (Value and growth returns are measured by the cumulative HML factor return in each period, as a proxy for their relative performance):
| Bull Market (Trough→Peak) | Early 12-mo: HML (Value–Growth) | Final 12-mo to Peak: HML |
|---|---|---|
| 1932–1937 (Great Depression rebound) | +35% (value thrived) | –20% (growth led into 1937) |
| 1949–1956 (post-WWII boom) | +18% (value outperformed) | –11% (growth outran value) |
| 1982–1987 (Reagan-era boom) | +25% (value surge after 1982) | –15% (growth dominance pre-1987) |
| 1987–2000 (long tech boom) | +8% (value rebound after ’87) | –30% (growth strongly led in dot-com finale) |
| 2002–2007 (pre-GFC expansion) | +20% (value rally after 2002) | –5% (growth edged out value) |
| 2009–2020 (post-GFC to COVID) | +40% (value very strong 2009–10) | –25% (growth dominated late) |
Values in the table are approximate cumulative HML returns. Positive HML indicates value stocks outperformed growth, and negative HML indicates growth outperformed value. Cross-checking against NBER dates, we see early-stage value outperformance coinciding with recoveries just after recessions, while late-stage growth leadership often coincides with the final expansion year before a recession.
Another interesting table of data for 8 bear markets going back to June 1926 is the following table from bridgeway.com, which they obtained based on Fama-French data:
| Small size (SMB) | Value (HML) | Momentum (MOM) | Profitability (RMW) | Conservative investments (CMA) | |
|---|---|---|---|---|---|
| All Months | 0.19 | 0.35 | 0.66 | 0.26 | 0.27 |
| Bull Markets | 0.27 | 0.29 | 0.52 | 0.14 | 0.12 |
| Bear Markets | -0.34 | 0.76 | 1.64 | 1.10 | 1.32 |
| 12M Pre Bear Mkt | 0.14 | -0.03 | 1.44 | -0.24 | 0.21 |
| 12M After Bear Mkt | 1.02 | 1.16 | -2.06 | -0.24 | 0.26 |
*Average returns through January 2020. HML data starts in July 1926. Momentum data starts in January 1927, and profitability and investment factors data start in July 1963
Source: Ken French Data Library and Bridgeway calculations
Observation of the above table: it’s clear that 12M Pre Bear Mkt (aka late stage of a bull market), momentum factor is outperforming. This is actually we have experienced so far. On the other hand, right at the bottom of a bear market or the beginning of a bull market, value stocks and small stocks excel.
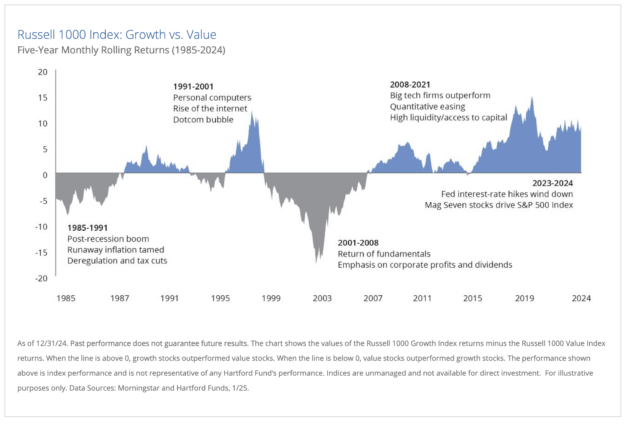
Another visual to support this growth vs. value thesis is this chart from Hartford:
Key Takeaways
A clear and consistent pattern emerges – value stocks tend to shine in the early bull-market phase, whereas growth stocks dominate as the cycle matures. In nearly every bull market, HML is strongly positive in the first year of the rally, confirming that value stocks bounce back faster from bear-market lows. For instance, after the 2008–09 crisis, value outperformed growth by an estimated 40 percentage points in the first 12 months of the new bull (2009) as deeply discounted stocks rebounded. This aligns with historical factor data showing value premiums spike coming out of bear markets. By contrast, in the final 12 months before nearly every major peak (e.g. 1929, 1937, 1969, 2000, 2007, 2020), HML turned negative – growth stocks were outperforming. On average across cycles since 1926, the year leading up to a bear market saw value underperform by about –1.3% per month (HML). Growth’s late-cycle dominance is evident in episodes like the late-1990s tech boom (huge negative HML) and the FAANG-led run-up to 2020.
While we generally favor high-quality stock funds, such as QARP funds or a solid large-blend fund like the S&P 500 (SPY, VOO, etc.), in a strategic or buy-and-hold portfolio, we also believe that value and growth style stocks can play a significant role when market cycles shift. This is especially true for a smart factor or style ETF rotation portfolio, such as P Composite Momentum Scoring Factor ETFs. The above study also validate our smart factor rotation strategy.
Fund Analysis: CLO Bond Funds |
We want to introduce our subscribers to a new type of bond fund: CLO bond funds. CLO stands for Collateralized Loan Obligation. A CLO bond is a type of bond backed by a group of corporate business loans (often BBB or lower rated, or called leveraged loans). The financial genius (no pun intended) further devises the following scheme, similar to MBS (mortgage-backed securities, remember subprime loan MBS?): a CLO bond is a collection of many (150 to 300) corporate loans/bonds that is further divided into so-called tranches:
- AAA-rated tranches (safest, paid first, lowest interest rate).
- BBB-rated tranches (moderate risk, higher interest rate).
- Equity tranches (highest risk, highest potential return).
Basically, for the same pool of high-yield bonds or loans, investors are divided into different tranches. AAA tranche investors get paid first and experience the lowest default risk, while equity tranche investors absorb most of the default losses first, followed by BBB tranche investors, and so on. Naturally, investors in higher-rated tranches receive lower interest payments in exchange for their lower risk exposure.
CLOs are popular because they offer higher yields than regular bonds and are structured to minimize risk for top-rated investors.
CLO interest rates are often floating rates, as their underlying loans are frequently floating rate adjusted. This makes them suitable for a rising rate environment. Furthermore, they often offer higher rates than other investment-grade or high-yield bonds in a low-interest-rate environment. However, as always, their biggest risk lies in credit risk.
How is a CLO Different from MBS and Subprime Mortgages?
Not to be confused with the infamous subprime crisis in a MBS, here are some differences:
| Feature | CLO (Collateralized Loan Obligation) | MBS (Mortgage-Backed Security) |
|---|---|---|
| Backed by | Corporate loans (to businesses) | Home mortgages (to individuals) |
| Risk | Diversified across industries | Tied to housing market |
| Crisis Resilience | Performed well in 2020 | Collapsed in 2008 due to subprime crisis |
| Liquidity | Actively managed, traded privately | More public, but can freeze in crisis |
CLOs were stress-tested in real time during the 2020 COVID crisis. In fact,
- In 2008, MBS collapsed because too many homeowners defaulted on subprime mortgages.
- In 2020, CLOs held up well during COVID—most AAA and BBB-rated CLO bonds did not default, showing their structure is more resilient than MBS. Why? Because businesses tend to manage debt better than individual homeowners, and CLOs are actively managed, meaning bad loans can be replaced.
Popular CLO ETFs and Returns
Janus Henderson AAA CLO ETF (JAAA) and B-BBB CLO ETF are the two most popular CLO ETFs in the market. The following table shows the most popular CLO ETFs and their comparison with corporate bonds (investment grade) and high yield short-term bonds ETFs:
| ETF Ticker | AUM (in $ Millions) | Trailing 12-Month Yield (%) |
|---|---|---|
| JAAA (Janus Henderson AAA CLO) | $4,250 | 5.30% |
| PAAA (PIMCO AAA CLO) | $2,100 | 5.15% |
| CLOA (VanEck CLO) | $1,750 | 6.2% |
| VCSH (Vanguard Short-Term Corporate Bond) | $41,500 | 3.95% |
| JBBB (Janus Henderson BBB CLO) | $1,200 | 7.50% |
| BCLO (BlackRock CLO) | $950 | 6.80% |
| CLOZ (WisdomTree Floating Rate Treasury Fund – CLO Focused) | $600 | 6.25% |
| SHYG (iShares 0-5 Year High Yield Corporate Bond) | $5,800 | 7.20% |
Returns:
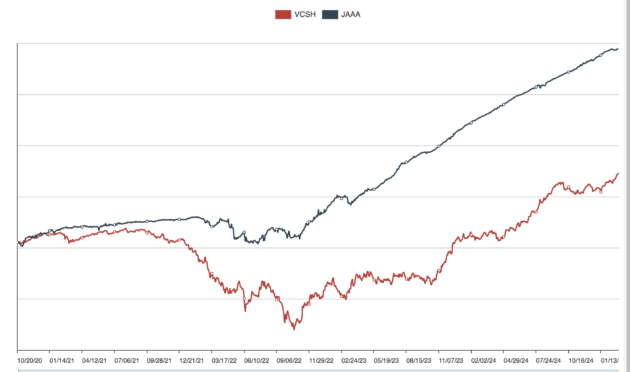
JAAA inception date: 0/20/2020
| Name | YTD Return | 1Yr AR | 3Yr AR |
|---|---|---|---|
| JAAA (Janus Detroit Street Trust Janus Henderson AAA CLO ETF) | 0.80% | 6.92% | 5.73% |
| VCSH (Vanguard Short-Term Corporate Bond ETF) | 1.48% | 6.63% | 2.84% |
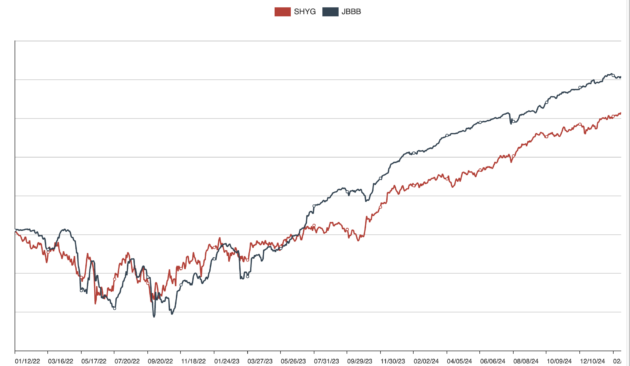
JBBB inception date: 1/12/2022
| Name | YTD Return | 1Yr AR | 3Yr AR |
|---|---|---|---|
| JBBB (Janus Henderson B-BBB CLO ETF) | 0.96% | 9.97% | 7.14% |
| SHYG (iShares 0-5 Year High Yield Corporate Bond ETF) | 2.17% | 9.58% | 5.77% |
Summary
Clearly, CLO ETFs have return advantages given their short term history. We believe these ETFs can have be part of candidate funds in a tactical portfolio, though we are not comfortable with holding them in a strategic portfolio. Using them in a tactical portfolio would help to avoid possible big loss in a distressed market but on the other hand, they might be able to help us to gain better returns in an up market.
Economic Indicators & Financial Markets |
Key economic indicators
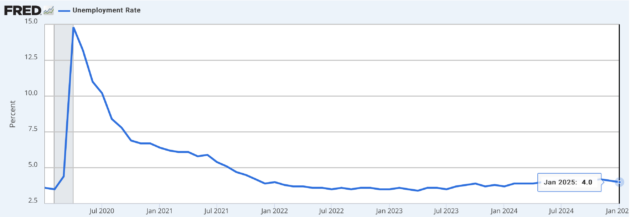
Labor markets
The January 2025 unemployment report showed a further slight decrease in the unemployment rate, now at 4.0%
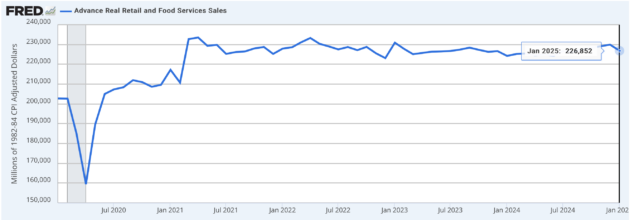
Consumer spending
In January, retail sales growth again surpassed the same period last year again. Consumer spending still remains healthy.
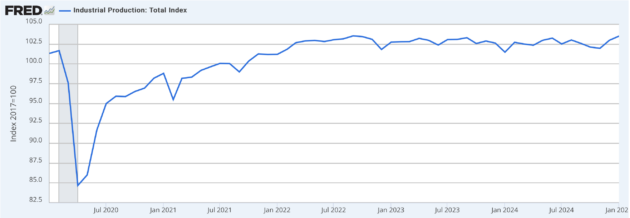
Industrial output
Industrial output in January continued to surpass the same period last year. The industrial activity was also healthy.
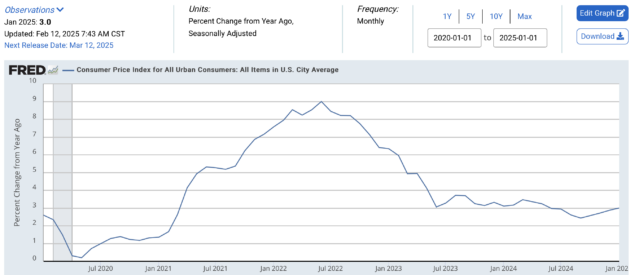
Inflation
Inflation, measured by the Consumer Price Index, rose again in January, now at 3.0%. This indicates that inflation is still high.
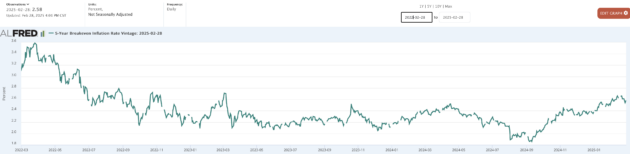
Inflation expectation or Five-Year Inflation Break Even Rate started to rise again, now at 2.58%, higher than 2.52 on 1/31/2025.
In summary, the economy remained relatively healthy in January, but inflation remains stubbornly high. See the market comments for the latest developments.
Asset trends
Stocks experienced loss in the last month. However, REITs, bonds and foreign stocks rose. Furthermore, hedged international stocks continue to have a clear advantage over Foreign stocks.
| Asset Class | 1 Weeks | 4 Weeks | 13 Weeks | 26 Weeks | 52 Weeks | Trend Score |
|---|---|---|---|---|---|---|
| US Stocks | -1.0% | -1.3% | -1.0% | 6.0% | 17.3% | 4.0% |
| Foreign Stocks | -1.1% | 1.8% | 0.8% | -1.8% | 6.3% | 1.2% |
| US REITs | 2.5% | 3.6% | -4.2% | -0.5% | 11.7% | 2.6% |
| Emerging Market Stocks | -3.7% | 0.2% | -2.0% | -0.4% | 7.7% | 0.4% |
| Bonds | 1.1% | 1.8% | 0.0% | 0.0% | 4.3% | 1.4% |
| Hedged Intl Stocks | 1.0% | 2.1% | 7.0% | 6.0% | 13.6% | 5.9% |
Model Portfolios |
Stock ETF model portfolios
| Name | YTD Return | 1Yr AR | 3Yr AR | 5Yr AR | 10Yr Ar | 15Yr Ar | 20Yr Ar |
|---|---|---|---|---|---|---|---|
| MyPlanIQ ETF Strategic Stock Allocation | 4.58% | 14.38% | 10.62% | 14.61% | 10.87% | NA | NA |
| MyPlanIQ ETF Tactical Stock Allocation | 0.21% | 10.62% | 10.35% | 14.48% | 11.00% | 13.44% | 15.17% |
| VT (Vanguard Total World Stock ETF) | 2.63% | 14.89% | 8.85% | 12.55% | 9.12% | 9.68% | NA |
Fixed-income ETF portfolio
| Name | YTD Return | 1Yr AR | 3Yr AR | 5Yr AR | 10Yr Ar | 15Yr Ar | 20Yr Ar |
|---|---|---|---|---|---|---|---|
| MPIQ ETF Fixed Income | 1.04% | 2.34% | 0.38% | -0.10% | 2.27% | NA | NA |
Fixed-income mutual fund portfolios customized to brokerages
| Name | YTD Return | 1Yr AR | 3Yr AR | 5Yr AR | 10Yr Ar | 15Yr Ar | 20Yr Ar |
|---|---|---|---|---|---|---|---|
| Schwab Total Return Bond | 1.71% | 3.55% | 2.10% | 0.45% | 2.27% | 4.57% | 5.73% |
| Fidelity Total Return Bond | 1.71% | 3.57% | 2.06% | 0.44% | 2.73% | 5.00% | 6.06% |
| Etrade Total Return Bond | 1.71% | 3.55% | 2.10% | 0.45% | 2.74% | 4.88% | 5.97% |
| Merrill Edge Total Return Bond | 2.00% | 4.24% | 2.33% | 0.58% | 2.74% | 5.20% | 5.65% |
| Vanguard Brokerage Total Return Bond | 1.44% | 4.87% | 2.06% | 0.28% | 2.50% | 4.50% | 5.72% |
| BND (Vanguard Total Bond Market ETF) | 2.77% | 5.98% | -0.41% | -0.56% | 1.51% | 2.36% | NA |
Selected advanced model portfolios
| Name | YTD Return | 1Yr AR | 3Yr AR | 5Yr AR | 10Yr Ar | 15Yr Ar | 20Yr Ar |
|---|---|---|---|---|---|---|---|
| P Composite Momentum Scoring Factor ETFs | 5.56% | 22.08% | 17.17% | 19.61% | 15.16% | 15.62% | NA |
| P Composite Momentum Scoring Fidelity Select Funds | 1.38% | 6.93% | 16.69% | 21.09% | 15.18% | 15.38% | 16.59% |
| SPY (SPDR S&P 500 ETF Trust) | 1.38% | 18.87% | 12.45% | 16.69% | 12.80% | 13.85% | 10.36% |
See this link for more Advanced Portfolios.
Funds to Watch |
Major assets
| Name | YTD Return | 1Yr AR | 3Yr AR | 5Yr AR | 10Yr Ar | 15Yr Ar | 20Yr Ar |
|---|---|---|---|---|---|---|---|
| VTI (Vanguard Total Stock Market ETF) | -0.72% | 14.50% | 10.99% | 15.26% | 12.08% | 13.40% | 10.24% |
| FNDX (Schwab Fundamental U.S. Large Company ETF) | 2.66% | 16.42% | 12.58% | 18.97% | 12.68% | NA | NA |
| SPY (SPDR S&P 500 ETF Trust) | -0.39% | 15.41% | 11.87% | 15.97% | 12.65% | 13.69% | 10.23% |
| VO (Vanguard Mid-Cap ETF) | 1.03% | 11.91% | 6.71% | 11.93% | 9.22% | 11.79% | 9.48% |
| VB (Vanguard Small-Cap ETF) | -3.50% | 6.02% | 5.15% | 10.84% | 8.30% | 11.03% | 8.97% |
| VNQ (Vanguard Real Estate ETF) | 5.90% | 12.24% | 0.47% | 4.63% | 5.32% | 9.27% | 7.35% |
| VEA (Vanguard FTSE Developed Markets ETF) | 7.59% | 8.33% | 6.62% | 8.56% | 5.59% | 6.05% | NA |
| HEFA (iShares Currency Hedged MSCI EAFE ETF) | 7.17% | 14.04% | 14.93% | 13.39% | 8.62% | NA | NA |
| FNDF (Schwab Fundamental International Equity ETF) | 7.95% | 8.56% | 8.20% | 10.71% | 5.94% | NA | NA |
| VWO (Vanguard FTSE Emerging Markets ETF) | 0.59% | 10.44% | 1.86% | 4.70% | 3.70% | 3.47% | NA |
| GLD (SPDR Gold Shares) | 10.16% | 36.08% | 13.84% | 11.63% | 8.73% | 5.98% | 9.56% |
| BND (Vanguard Total Bond Market ETF) | 3.00% | 5.85% | -0.24% | -0.62% | 1.54% | 2.37% | NA |
Factor and sector ETFs
| Name | YTD Return | 1Yr AR | 3Yr AR | 5Yr AR | 10Yr Ar | 15Yr Ar | 20Yr Ar |
|---|---|---|---|---|---|---|---|
| QUAL (iShares MSCI USA Quality Factor ETF) | 0.57% | 11.53% | 12.72% | 15.57% | 12.47% | NA | NA |
| MTUM (iShares MSCI USA Momentum Factor ETF) | 3.59% | 15.04% | 11.84% | 12.80% | 13.01% | NA | NA |
| VTV (Vanguard Value ETF) | 4.25% | 14.99% | 9.50% | 13.43% | 10.35% | 11.86% | 8.77% |
| USMV (iShares MSCI USA Min Vol Factor ETF) | 6.34% | 17.28% | 10.00% | 10.14% | 10.57% | NA | NA |
| SPGP (Invesco S&P 500 GARP ETF) | -2.11% | 2.09% | 5.91% | 14.31% | 13.00% | NA | NA |
| QARP (Xtrackers Russell 1000 US Quality at a Reasonable Price ETF) | 1.64% | 14.04% | 11.05% | 15.98% | NA | NA | NA |
| FNDX (Schwab Fundamental U.S. Large Company ETF) | 2.66% | 16.42% | 12.58% | 18.97% | 12.68% | NA | NA |
| QQQ (Invesco QQQ Trust Series I) | -2.77% | 12.61% | 14.01% | 19.63% | 17.32% | 18.37% | 14.74% |
| VHT (Vanguard Health Care ETF) | 7.14% | 2.92% | 4.91% | 10.28% | 8.89% | 12.70% | 10.32% |
| XLP (Consumer Staples Select Sector SPDR Fund) | 6.25% | 15.23% | 6.03% | 9.61% | 8.12% | 10.67% | 9.32% |
| VNQ (Vanguard Real Estate ETF) | 5.90% | 12.24% | 0.47% | 4.63% | 5.32% | 9.27% | 7.35% |
| XLU (Utilities Select Sector SPDR Fund) | 4.81% | 30.42% | 7.89% | 7.43% | 9.44% | 10.58% | 8.83% |
| VIG (Vanguard Dividend Appreciation ETF) | 2.75% | 14.30% | 10.30% | 13.54% | 11.48% | 12.37% | NA |
Total return bond funds
Active funds
| Name | YTD Return | 1Yr AR | 3Yr AR | 5Yr AR | 10Yr Ar | 15Yr Ar | 20Yr Ar |
|---|---|---|---|---|---|---|---|
| PRWCX (T. ROWE PRICE CAPITAL APPRECIATION FUND) | 1.96% | 3.17% | 1.95% | 4.69% | 4.29% | 6.00% | 4.74% |
| VPMCX (VANGUARD PRIMECAP FUND INVESTOR SHARES) | 5.41% | 8.21% | 4.77% | 7.00% | 5.72% | 8.36% | 6.27% |
| FCNTX (Fidelity Contrafund) | 2.71% | 17.97% | 13.83% | 17.48% | 14.17% | 14.84% | 12.11% |
| OAKMX (OAKMARK FUND INVESTOR CLASS) | 4.61% | 17.27% | 12.04% | 18.38% | 11.85% | 13.48% | 10.55% |
| DODGX (DODGE & COX STOCK FUND DODGE & COX STOCK FUND) | 7.01% | 12.08% | 5.63% | 11.75% | 9.21% | 11.31% | 8.19% |
| FDGRX (FIDELITY GROWTH COMPANY FUND FIDELITY GROWTH COMPANY FUND) | -3.07% | 10.14% | 7.69% | 13.26% | 13.49% | 15.41% | 12.81% |
| AGTHX (GROWTH FUND OF AMERICA CLASS A) | 1.21% | 19.48% | 10.98% | 15.31% | 12.75% | 13.43% | 10.69% |
| TCAF (T. Rowe Price Capital Appreciation Equity ETF) | 1.29% | 15.12% | NA | NA | NA | NA | NA |
| CGUS (Capital Group Core Equity ETF) | 0.89% | 17.67% | 13.24% | NA | NA | NA | NA |
| CGGR (Capital Group Growth ETF) | 0.24% | 20.83% | 14.46% | NA | NA | NA | NA |
| CGDV (Capital Group Dividend Value ETF) | 4.88% | 21.16% | 15.58% | NA | NA | NA | NA |
2025 Market Overview |
We had several significant developments last month:
On the earnings front, 97% of S&P 500 companies have reported their Q4 2024 earnings. The blended growth rate stands at 18.2%, significantly surpassing the 11.1% expected as of December 31, 2024. Looking ahead to next quarter’s earnings, the outlook is mixed: 59% of companies (58 out of 98) have issued negative EPS guidance for Q1 2025. This is slightly above the five-year average of 58% but below the ten-year average of 62%.
Now some negatives:
In February 2025, U.S. consumer confidence experienced a significant decline, with The Conference Board’s Consumer Confidence Index® dropping 7.0 points to 98.3—the largest monthly decrease since August 2021. Additionally, consumers’ 12-month inflation expectations surged to 6%, the highest since May 2023.
Meanwhile, bearish sentiment abounds. In late February 2025, the American Association of Individual Investors (AAII) reported that bearish sentiment—expectations that stock prices will decline over the next six months—surged to 60.6%. This marks the seventh-highest level of bearish sentiment since the survey’s inception in 1987.
As of this writing, Trump has confirmed that the 25% tariff on Mexico and Canada will take effect tomorrow (March 4, 2025). This has caused another significant drop in the stock markets.
Our take: while it’s still somewhat early to predict a recession, the current market volatility and the economic uncertainty are not unexpected.
As always, we claim no crystal ball and we call for staying the course which is guided by well-defined and sound strategic and tactical strategies:
- For strategic allocation (buy and hold) investors, ignore the current market behavior. Remember, as we have emphasized numerous times when you choose and commit to a strategic portfolio, you essentially know and commit that your investment horizon (or the time you need to utilize this capital) is 20 years, preferably much longer, given the current high valuation. As we pointed out, if your investments are those diversified (index) funds such as an S&P 500 index fund (VFINX, for example), you know your money is in some solid ‘business’ that eventually (20 years later and preferably many more years later) will deliver some reasonable returns. If you are comfortable with this thesis, you should sit tight and forget about the current gyration.
- For tactical investors, again, you have to ignore the current market noise. Also, you should follow your strategy rigorously, especially during this time. Human emotion, both optimistic and pessimistic, and human desire, both greedy and fearful, are your worst enemies. This is true time and time again.
We again would like to emphasize that for any new investor and new money, the best way to step into this kind of market is through dollar cost average (DCA), i.e., invest and/or follow a model portfolio in several phases (such as 2 or 3 months) instead of the whole sum at one shot.
Struggling to Select Investments for Your 401(k), IRA, or Brokerage Accounts?