Lazy portfolios — usually just some mix of index funds or broad ETFs — are meant to be simple, low-maintenance, and reasonably diversified. You set it up once and let it run. That’s the whole appeal. But the truth is, they don’t all behave the same, especially when markets get weird. Some hold up better in drawdowns. Some ride the bull runs a bit more. Depends on the mix.
So it helps to look a little deeper — things like max drawdown, rolling returns, how the allocation is set up (stocks vs bonds, domestic vs international, gold and other commodities or inflation-protected bonds, that sort of thing). These give you a better sense of what kind of ride you’re signing up for. Not just the average return, but how it gets there. Because markets don’t move in straight lines. And most of the time, neither does your portfolio.
Background: Key Concepts and Portfolio Categories
Before diving into performance metrics, let’s establish some foundational knowledge:
Maximum Drawdown
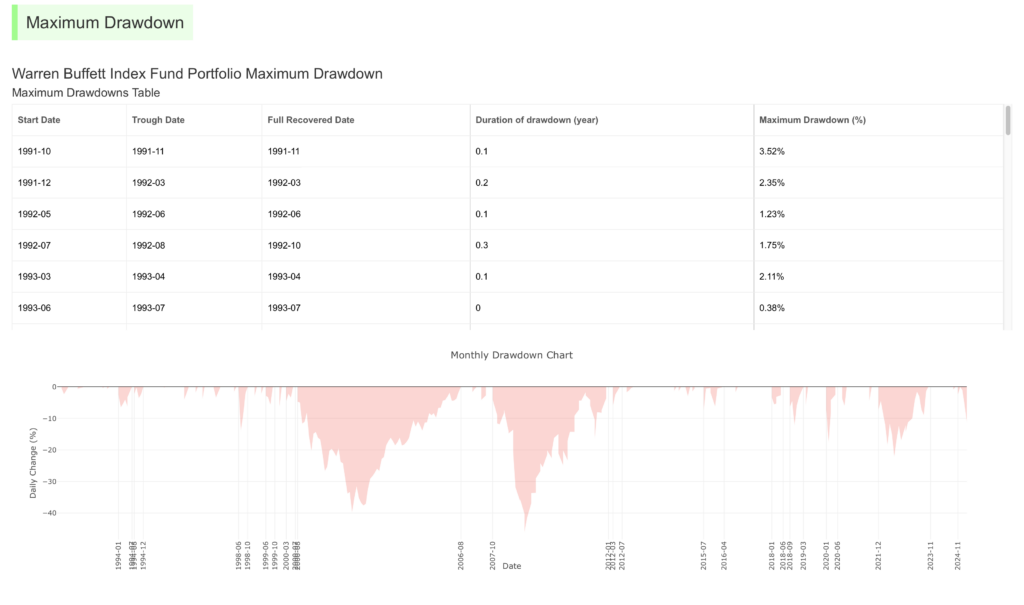
Maximum drawdown just tells you the worst fall your portfolio went through before it bounced back — from peak to bottom, basically. So if you had $100,000 and it dropped to $80,000 at some point, that’s a 20% drawdown, even if it eventually recovered.
It’s not about the average return or the final outcome. It’s more about how bad things got in the middle. And that matters. Because for most people, those moments — when things are down big — that’s when the real test happens. Not just financial, but emotional too. If you can’t sit through that kind of loss, maybe the portfolio’s too aggressive. Or maybe it just needs some tweaking.
In MyPlanIQ, every portfolio has its maximum drawdown data. For example, we maintain the following table and chart for the maximum drawdowns for Warren Buffett Index Fund Portfolio:
Rolling Returns
Rolling returns analyze performance over overlapping periods, such as every possible 3-year or 10-year window within a given timeframe. These rolling return serieses or charts illustrate how well a portfolio behaves in any particular period such as 3-year periods. For example, the following chart shows the rolling 5-year return chart for Harry Browne Permanent Portfolio:
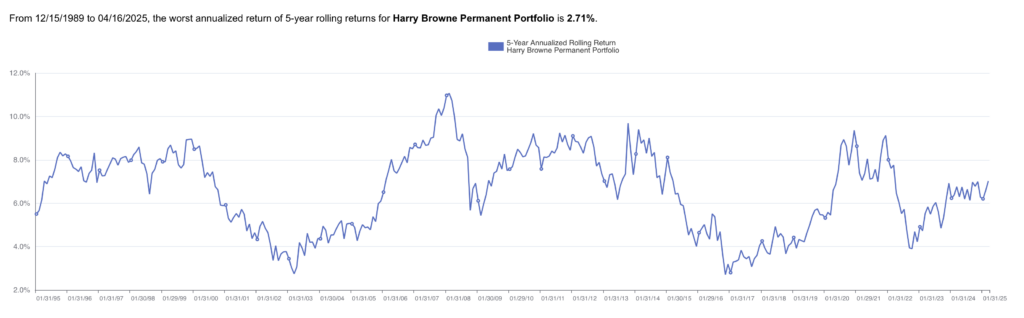
From the above chart, we can see that since 1995, if you invest in any time, you will get minimum 2.71% annualized return after 5 years. This would give you a sense of how smooth the portfolio is if you invest for a 5 year period.
Two Categories of Lazy Portfolios
Lazy portfolios generally fall into two categories:
- Traditional Lazy Portfolios: These focus on broad market exposure through U.S. stocks, international stocks, and bonds. They prioritize growth and are ideal for younger investors with longer time horizons.
- Non-Traditional Lazy Portfolios: These incorporate alternative assets like gold, cash, real estate, or inflation-protected bonds (TIPS). They emphasize stability and downside protection, making them suitable for risk-averse or near-retirement investors.
With this background in mind, let’s explore how traditional and non-traditional lazy portfolios perform in different market conditions.
Traditional Lazy Portfolios: Built for Growth
The most popular lazy portfolio is the Bogleheads Three Fund Portfolio, which provides a simple yet effective blend of domestic and international equities alongside fixed income. A typical allocation might look like this:
- VTI (Vanguard Total Stock Market ETF, 50%)
- VEA (Vanguard FTSE Developed Markets ETF, 30%)
- BND (Vanguard Total Bond Market ETF, 20%)
This structure balances domestic growth with global diversification and bond stability, making it a solid choice for long-term investors.
Performance in Bull Markets
During extended bull markets, traditional lazy portfolios tend to shine. For example, during the 2010–2021 bull market:
- The Bogleheads Three Fund Portfolio delivered an average compound annual growth rate (CAGR) of 10.2%.
- Volatility, measured by standard deviation, was relatively moderate at 13.8%
- Maximum drawdown during the short correction in the Covid-19 pandemic reached about -17.4%, but these declines were quickly recovered due to strong equity performance
In essence, traditional portfolios capture most of the upside in rising markets while relying on bonds to cushion mild downturns.
Performance in Bear Markets
While traditional portfolios excel in bull markets, they can be vulnerable during sharp downturns. For instance:
- During the 2008 financial crisis, the Three-Fund Portfolio lost more than -42.7%! This is a very large drawdown that might make some investors nervous.
- In the 2020 COVID crash (Q1), the portfolio dropped approximately -14% .
These losses highlight the sensitivity of traditional portfolios to equity shocks, even with bond diversification.
Non-Traditional Lazy Portfolios: Built for Stability
Non-traditional lazy portfolios take a different approach by including assets that don’t correlate closely with stocks or bonds. A classic example is Harry Browne Permanent Portfolio, which allocates equally across four asset classes:
- Stocks: 25%
- Long-Term Bonds: 25%
- Gold: 25%
- Cash or Short-Term Bonds: 25%
This design aims to thrive in various economic environments: prosperity, inflation, deflation, and recession.
Performance in Bull Markets
While robust in volatile markets, non-traditional portfolios lag behind in roaring bull markets. During the same 2010–2021 period:
- Average return was closer to 6.9% CAGR.
- Standard deviation was much lower at 6.1%, reflecting reduced volatility.
- However, the heavy allocation to non-equity assets caused significant underperformance during equity-led rallies, as can be seen to compare with 10.2% CAGR of Bogleheads Three Fund Portfolio.
In other words, non-traditional portfolios trade higher returns for greater peace of mind and stability.
Performance in Bear Markets
Non-traditional portfolios truly shine during bear markets, offering substantial downside protection. For example:
- During the 2008 financial crisis, the Permanent Portfolio fell less than -13.6% .
- In the 2020 COVID crash (Q1), the portfolio declined only around -1.7% .
The inclusion of gold and cash significantly dampens drawdowns, providing a smoother ride during turbulent times.
Risk Metrics: Beyond Simple Returns
The following are the return comparison for the two portfolios: from 7/26/2007 to 4/16/2025
| Name | YTD Return | 1Yr AR | 3Yr AR | 5Yr AR | 10Yr AR | 15Yr AR | 20Yr AR | Inception |
|---|---|---|---|---|---|---|---|---|
| Bogleheads Three Fund Portfolio | -3.74% | 6.37% | 5.63% | 10.69% | 7.35% | 8.35% | NA | 6.81% |
| Harry Browne Permanent Portfolio | 4.74% | 14.07% | 6.73% | 5.96% | 6.16% | 6.43% | 6.92% | 6.81% |

Investors often focus on returns without considering the risks involved. Let’s compare hypothetical 10-year performance scenarios using placeholder metrics:
| Metric | Traditional 3-Fund | Non-Traditional (Permenant ) |
|---|---|---|
| CAGR | 10.2% | 6.9% |
| Standard Deviation | 9.6% | 4.3% |
| Max Drawdown | -42.7% | -13.6% |
| Sharpe Ratio | 0.34 | 0.71 |
| Worst Rolling 3-Year | -5.5% | -0.8% |
The non-traditional portfolio exhibits lower volatility and greater consistency, albeit with capped returns. Conversely, the traditional portfolio delivers superior performance during expansionary periods but suffers sharper setbacks.
Rolling Returns: The Consistency Test
Rolling returns give you a better feel for how a portfolio behaves over time — not just the one-time result, but the kind of ride you get if you started at different points. Like, how did it do over any given 10-year stretch, not just from point A to point B.
Thing is, those numbers can swing a lot. A plain old traditional portfolio — stocks and bonds, the usual 60/40 types — might show anywhere from 4% to 9% annualized depending on when you looked. Big spread. But once you add in things like gold, or TIPS, or other diversifiers… suddenly it gets steadier. Not huge upside, but you’re sitting in that 4.5–6% zone more often, even when markets go haywire.
So the trade-off’s kind of simple. If you’re chasing the higher possible return, traditional’s probably the way. But if you care more about steady compounding — protecting capital and not getting smacked around too much — then the non-traditional mix might suit you better. Just depends on what you value more: the ceiling or the floor.
Conclusion: Which Lazy Portfolio Suits Your Needs?
Choosing the right lazy portfolio depends on your individual goals, risk tolerance, and investment horizon. Here’s a simplified breakdown:
| Investor Type | Portfolio Type | Why? |
|---|---|---|
| Young, growth-oriented | Traditional (VTI/VEA/BND) | Higher returns over decades |
| Nearing retirement | Blended or non-traditional | Lower drawdowns, more stability |
| Risk-averse or preservation-focused | Permanent Portfolio | Smooth ride, inflation hedging |
If you’re looking for something in-between — not all-in on growth, but not overly cautious either — hybrid portfolios might be worth a look. Just a small tilt, like adding 5–10% in gold, real assets, maybe a few diversifiers outside the usual stock-bond playbook. Sometimes that’s enough to smooth the edges without giving up too much on the upside.
But really, the “best” lazy portfolio? It’s just the one you’ll actually stick with. Through the noise, the dips, the weird stretches where nothing makes sense. Whether it’s sitting in your IRA, your taxable account, or inside a 401(k) menu, the key thing is knowing how it behaves — in good times and bad. That’s how you build something durable. Not perfect, but steady. Something that fits you.