 |
Vanguard ETF: |  |
7.4%* |
|
Diversified Core: | |
8.1%* |
|
Six Core Asset ETFs: | |
7.3%* |
Articles on VEXMX
- REIT and Commodities In Simple Six Fund Portfolio Shows Up Aronson's Lazy Portfolio
04/20/2011
The incidents in Japan, the Middle East and even as far back as New Orleans teach us the danger of living on borrowed time, the reactors, the governments the levees keeping things going -- just one more year. The temptation to delay until next time is very seductive until disaster strikes and the cost to repair, dwarfs the cost to prevent. Many working people put off their retirement investing -- just one more year until it becomes a "hair on fire" problem -- which it now is for baby boomers for whom retirement is a near and present danger.
We continue to examine luminary portfolios to see what we can learn and use to further our investment portfolios.
Ted Aronson and his AJO Partners manage about $25 billion of institutional assets. Aronson puts his family's taxable money in this well-diversified portfolio of no-load index funds.
Fund Weight Ticker ETF US Equities 40% VFINX, VEXMX, VISGX, VTSMX, VISXX VTI, TMW, VBK, VBR International Equity 20% VPACX, VEURX VEA Emerging Markets 10% VEIEX EEM US Bonds 30% VIPSX, VUSTX, VWEHX TIP, LQD, HYG
This is a well diversified four asset class portfolio with an aggressive profile. The US equities are broadly diversified. Asia Pacific is put above Europe for developed markets. There is a diversified set of fixed income with VWEHX and VUSTX being relatively high risk. The long term treasury bond has proved to be a good diversifier in recent history -- today all bonds are under pressure so this may be less true.
The US component is possibly over-weighted and emerging markets could be increased or, even better, some real estate assets could be added.This portfolio was last reviewed at the end of the year and we now re-examine performance over the last three months as we see markets changing and inflation becoming more of a present reality.
This lazy portfolio will be compared with six asset class SIB to examine the returns of four and six asset class portfolios
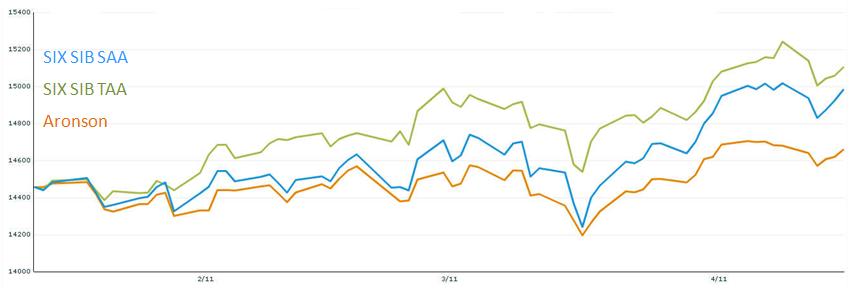
Portfolio Performance Comparison
Portfolio/Fund Name 1Yr AR 1Yr Sharpe 3Yr AR 3Yr Sharpe 5Yr AR 5Yr Sharpe Aronson Original 6% 74% 2% 14% 3% 16% Six Core Asset ETF Benchmark Tactical Asset Allocation Moderate 10% 71% 9% 73% 13% 91% Six Core Asset ETF Benchmark Strategic Asset Allocation Moderate 13% 103% 3% 20% 7% 35% full comparison
The Aronson portfolio has four asset classes missing out on REIT and commodities. The performance over the last five years has not been exceptional with the Simple SIB able to beat it across the board.Over the last three months, REIT and commodities have been in favor and having neither has had an impact on the Aronson returns.Takeaways- The Aronson lazy portfolio has moderate returns that can be beaten
- Having broader diversification pays off as market conditions change
- ETFs can readily be used to implement these portfolios with good performance
- A 10% spread over five years means that it’s worth looking at alternatives
Disclosure:MyPlanIQ does not have any business relationship with the company or companies mentioned in this article. It does not set up their retirement plans. The performance data of portfolios mentioned above are obtained through historical simulation and are hypothetical.The incidents in Japan, the Middle East and even as far back as New Orleans teach us the danger of living on borrowed time, the reactors, the governments the levees keeping things going -- just one more year. The temptation to delay until next time is very seductive until disaster strikes and the cost to repair, dwarfs the cost to prevent. Many working people put off their retirement investing -- just one more year until it becomes a "hair on fire" problem -- which it now is for baby boomers for whom retirement is a near and present danger.
Exchange Tickers: (NYSE: VFINX), (NYSE: VEXMX), (NYSE: VISGX), (NYSE: VTSMX), (NYSE: VISXX), (NYSE: VTI), (NYSE: TMW), (NYSE: VBK), (NYSE: VBR), (NYSE: VPACX), (NYSE: VEURX), (NYSE: VEA), (NYSE: VEIEX), (NYSE: EEM), (NYSE: VIPSX), (NYSE: VUSTX), (NYSE: VWEHX), (NYSE: TIP), (NYSE: LQD), (NYSE: HYG)
- REIT and Commodities In Simple Six Fund Portfolio Shows Up Aronson's Lazy Portfolio
04/19/2011
The incidents in Japan, the Middle East and even as far back as New Orleans teach us the danger of living on borrowed time, the reactors, the governments the levees keeping things going -- just one more year. The temptation to delay until next time is very seductive until disaster strikes and the cost to repair, dwarfs the cost to prevent. Many working people put off their retirement investing -- just one more year until it becomes a "hair on fire" problem -- which it now is for baby boomers for whom retirement is a near and present danger.
We continue to examine luminary portfolios to see what we can learn and use to further our investment portfolios.
Ted Aronson and his AJO Partners manage about $25 billion of institutional assets. Aronson puts his family's taxable money in this well-diversified portfolio of no-load index funds.
Fund Weight Ticker ETF US Equities 40% VFINX, VEXMX, VISGX, VTSMX, VISXX VTI, TMW, VBK, VBR International Equity 20% VPACX, VEURX VEA Emerging Markets 10% VEIEX EEM US Bonds 30% VIPSX, VUSTX, VWEHX TIP, LQD, HYG
This is a well diversified four asset class portfolio with an aggressive profile. The US equities are broadly diversified. Asia Pacific is put above Europe for developed markets. There is a diversified set of fixed income with VWEHX and VUSTX being relatively high risk. The long term treasury bond has proved to be a good diversifier in recent history -- today all bonds are under pressure so this may be less true.
The US component is possibly over-weighted and emerging markets could be increased or, even better, some real estate assets could be added.This portfolio was last reviewed at the end of the year and we now re-examine performance over the last three months as we see markets changing and inflation becoming more of a present reality.
This lazy portfolio will be compared with six asset class SIB to examine the returns of four and six asset class portfolios
Portfolio Performance Comparison
Portfolio/Fund Name 1Yr AR 1Yr Sharpe 3Yr AR 3Yr Sharpe 5Yr AR 5Yr Sharpe Aronson Original 6% 74% 2% 14% 3% 16% Six Core Asset ETF Benchmark Tactical Asset Allocation Moderate 10% 71% 9% 73% 13% 91% Six Core Asset ETF Benchmark Strategic Asset Allocation Moderate 13% 103% 3% 20% 7% 35% full comparison
The Aronson portfolio has four asset classes missing out on REIT and commodities. The performance over the last five years has not been exceptional with the Simple SIB able to beat it across the board.Over the last three months, REIT and commodities have been in favor and having neither has had an impact on the Aronson returns.Takeaways- The Aronson lazy portfolio has moderate returns that can be beaten
- Having broader diversification pays off as market conditions change
- ETFs can readily be used to implement these portfolios with good performance
- A 10% spread over five years means that it’s worth looking at alternatives
Disclosure:MyPlanIQ does not have any business relationship with the company or companies mentioned in this article. It does not set up their retirement plans. The performance data of portfolios mentioned above are obtained through historical simulation and are hypothetical.The incidents in Japan, the Middle East and even as far back as New Orleans teach us the danger of living on borrowed time, the reactors, the governments the levees keeping things going -- just one more year. The temptation to delay until next time is very seductive until disaster strikes and the cost to repair, dwarfs the cost to prevent. Many working people put off their retirement investing -- just one more year until it becomes a "hair on fire" problem -- which it now is for baby boomers for whom retirement is a near and present danger.Symbols: VFINX, VEXMX, VISGX, VTSMX, VISXX, VTI, TMW, VBK, VBR, VPACX, VEURX, VEA, VEIEX, EEM, VIPSX, VUSTX, VWEHX, TIP, LQD, HYG
- Hewlett Packard 401K Report On 06/13/2011
06/13/2011
Retirement investing is a long term process. This report reviews Hewlett Packard 401K plan. We will discuss the investment choices and present the plan rating by MyPlanIQ. Current economic and market conditions are discussed in the context of the investment portfolios in the plan. We will then show how investors in Hewlett Packard 401K can achieve reasonable investment results using asset allocation strategies.
Plan Review and Rating
Hewlett Packard (Ticker:HPQ) has the "Hewlett Packard 401K".
Hewlett Packard Company (commonly known as 'HP') (NYSE: HPQ) is one of the largest IT companies. Founded by Bill Hwelett and Dave Packard in Palo Alto, California, HP was the earliest technology company that eventually led the formation of Silicon Valley in the San Francisco bay area. Today Hewlett-Packard has over 300 thousands employees world wide.
HP is renown to be employee friendly. It has been named several times as one of the best companies to work for. Its 401k plan provides a fairly diversified array of high quality funds.
Hewlett Packard 401K's 401K plan consists of 29 funds. These funds enable participants to gain exposure to 5 major assets: US Equity, Foreign Equity, Emerging Market Equity, REITs, Fixed Income.
As of Jun 13, 2011, this plan investment choice is rated as above average based on MyPlanIQ Plan Rating methodology that measures the effectiveness of a plan's available investment funds. It has the following detailed ratings:
Diversification -- Rated as great (97%)
Fund Quality -- Rated as average (62%)
Portfolio Building -- Rated as above average (65%)
Overall Rating: above average (74%)Current Economic and Market Conditions
Last week marked the sixth week of losses in the U.S. stock market. Investors are now clearly in a risk off mode. Key observations include
- U.S. stock market index (Vanguard Total Stock Market Index (VTI)), for example, is now ranked below U.S. 7-10 long term treasury bonds (IEF) and just a notch above credit bond index (CFT) in our major trend table.
- For the time being, commodities (DBC) and Gold (GLD) are still holding first places, with international REITs (RWX) is still strong.
- On the fixed income side, long bonds (TLT) (LQD) are now trending higher while emerging market bonds (PCY) is still holding a higher place.
This shows investors' strong risk aversion but it is still not water shed flight to safety moment yet. Again, we are vigilant to monitor how markets are unfolding here.
For more information on how these assets are ranked, please see here.
Assets Class Symbols 05/27
Trend
Score05/20
Trend
ScoreDirection International REITs RWX 11.77% 10.82% ^ Commodities DBC 10.84% 10.32% ^ US Equity REITs VNQ 10.77% 10.41% ^ Gold GLD 9.42% 10.06% v Emerging Market Stks VWO 8.56% 6.72% ^ US Stocks VTI 8.29% 8.23% ^ International Developed Stks EFA 6.77% 5.23% ^ US High Yield Bonds JNK 6.37% 6.37% v International Treasury Bonds BWX 5.96% 4.66% ^ Frontier Market Stks FRN 4.05% 4.27% v Emerging Mkt Bonds PCY 3.57% 4.27% v Intermediate Treasuries IEF 2.71% 2.39% ^ US Credit Bonds CFT 2.5% 2.81% v Municipal Bonds MUB 2.13% 2.0% ^ Total US Bonds BND 1.99% 1.92% ^ Mortgage Back Bonds MBB 1.75% 1.8% v Treasury Bills SHV 0.07% 0.02% ^ Portfolio Discussions
The chart and table below show the historical performance of moderate model portfolios employing strategic and tactical asset allocation strategies. For comparison purpose, we also include the moderate model portfolios of a typical 5 asset SIB (Simpler Is Better) plan . This SIB plan has the following candidate index funds and their ETFs equivalent:
US Equity: SPY or VTI
Foreign Equity: EFA or VEU
Emerging Market Equity: EEM or VWO
REITs: IYR or VNQ or ICF
Fixed Income: AGG or BND
Performance chart (as of Jun 13, 2011)Performance table (as of Jun 13, 2011)
Portfolio Name 1Yr AR 1Yr Sharpe 3Yr AR 3Yr Sharpe 5Yr AR 5Yr Sharpe Hewlett Packard 401K Tactical Asset Allocation Moderate 9% 94% 11% 87% 12% 93% Hewlett Packard 401K Strategic Asset Allocation Moderate 15% 201% 5% 26% 6% 36% Five Core Asset ETF Benchmark Tactical Asset Allocation Moderate 10% 102% 9% 74% 11% 77% Five Core Asset ETF Benchmark Strategic Asset Allocation Moderate 16% 154% 4% 17% 7% 27% Currently are doing well. But these asset classes are not available to Hewlett Packard 401K participants.
To summarize, investors adopting Hewlett Packard 401K plan can achieve reasonable investment returns by adopting asset allocation strategies that are tailored to their risk profiles.
Symbols:HPQ, CASH, SPY, VTI, VEU, VWO, VNQ, BND, ICAEX, ARTIX, PHIYX, LZEMX, PRRIX, VPMCX, RNWFX, PIGLX, MIDJX, DODFX, DSFRX, FMAGX, FCNTX, FRESX, FLPSX, DODGX, PTRIX, PEBIX, PISIX, PIGIX, PFMIX, PTSHX, PFGCX, VEXMX, CRIMX
Exchange Tickers: (HPQ), (CASH), (SPY), (VTI), (VEU), (VWO), (VNQ), (BND), (ICAEX), (ARTIX), (PHIYX), (LZEMX), (PRRIX), (VPMCX), (RNWFX), (PIGLX), (MIDJX), (DODFX), (DSFRX), (FMAGX), (FCNTX), (FRESX), (FLPSX), (DODGX), (PTRIX), (PEBIX), (PISIX), (PIGIX), (PFMIX), (PTSHX), (PFGCX), (VEXMX), (CRIMX) - Hewlett Packard 401K Report On 06232011
06/23/2011