 |
Vanguard ETF: |  |
7.4%* |
|
Diversified Core: | |
8.1%* |
|
Six Core Asset ETFs: | |
7.3%* |
Articles on VBK
- Using Asset Classes in Amerivest Guided Portfolios to Construct ETF Portfolios
07/22/2011
We have just released ETF based plan Amerivest Guided Portfolios Based ETF Plan that uses index ETFs to represent the asset classes suggested by the Amerivest balanced portfolio. Based on Amerivest, the model portfolios are suggested by Morningstars.
One can see the list of ETFs used in this plan from the Investment Options of the plan.
This plan investment choice is rated as average based on our plan rating methodology that measures the effectiveness of a plan's available investment funds. It has the following detailed ratings:
Diversification -- Rated as great (94%)
Fund Quality -- Rated as below average (26%)
Portfolio Building -- Rated as below average (23%)
Overall Rating -- Average (45%)The performance has been reasonable.
Portfolio Performance Comparison
Portfolio/Fund Name 1Yr AR 1Yr Sharpe 3Yr AR 3Yr Sharpe 5Yr AR 5Yr Sharpe VFINX 23% 151% 3% 15% 3% 8% Amerivest Guided Portfolios Based ETF Plan Strategic Asset Allocation Moderate 19% 181% 3% 17% 6% 34% Amerivest Guided Portfolios Based ETF Plan Tactical Asset Allocation Moderate 14% 125% 7% 44% 11% 76% VBINX 16% 203% 6% 32% 5% 28% Both SAA and TAA portfolios beat the general S&P 500 (SPX) (VFINX) and the balanced portfolio index (VBINX) in the last 5 years.
See more detailed comparison from our comparison tool here. Users can change the parameters on that page to compare with other portfolios or funds.
See the SeekingAlpha article for some detailed description on this plan.
In general, this is a good plan that has very good diversification. Users can do more comparison and studies on this.
Symbols: BIV, SPX, BLV, BND, BSV, BWX, DBC, EMB, GWX, IWC, JNK, MBB, TIP, VBK, VBR, VEU, VNQ, VOE, VOT, VTI, VTV, VUG, VWO, Brokerage Plans
- US Small Cap Growth ETFs Continue Strong Gains
05/05/2011
Small cap ETFs are generally made up of investments in companies with less than $1 billion in market capitalization. Small Cap Growth ETFs offer investors diversification throughout a wide range of industries and the potential for very high returns. At the same time, these ETFs tend to move up and down with the market and are subject to high levels of volatility.
US Small Cap Growth ETFs, represented by the iShares Russell 2000 Small Cap Growth Index ETF (IWO), continued to outperform other styles of US Equity Assets with a one week return of 2.66% and a trend score of 13.93%. The small cap growth sector has also outperformed other US Equity Assets over a 52 week period, returning 24.31% in the past year. (See Russell Table)
US Equity Style Return
4/29/2011
Assets Class Symbols 04/27
Trend
Score04/20
Trend
ScoreDirection Russell Smallcap Growth IWO 14.01% 13.06% ^ Russell Midcap Growth IWP 12.57% 11.91% ^ Russell Smallcap Index IWM 11.05% 9.92% ^ Russell Midcap Indedx IWR 10.9% 10.15% ^ Russell Midcap Value IWS 9.84% 9.03% ^ Russell Largecap Growth IWF 9.25% 8.24% ^ Russell Smallcap Value IWN 8.56% 7.26% ^ Russell Largecap Index IWB 8.52% 7.38% ^ Russell Largecap Value IWD 8.15% 6.96% ^ The trend score is defined as the average of 1,4,13,26 and 52 week total returns (including dividend reinvested).
U.S. Small Cap Growth
04/29/2011Description Symbol 1 Yr 3 Yr 5 Yr Avg. Volume(K) 1 Yr Sharpe Vanguard Small Cap Growth ETF VBK 27.33% 10.31% 6.52% 248 121.29% iShares Russell 2000 Growth In IWO 26.68% 9.57% 4.89% 1,679 119.24% iShares S&P SmallCap 600 Growth IJT 24.47% 8.6% 5.17% 187 121.82%
Among US Small Cap Growth ETFs, the Vanguard Small Cap Growth ETF (VBK) has shown the most strength, returning 27.33% in the past year. Others, including the iShares Russell 2000 Growth Index ETF (IWO) and the iShares S&P SmallCap 600 Growth ETF (UT) have also provided investors with returns higher than 24%.
In recent periods, equities have experienced high levels of growth, leading many to speculate that a retraction is inevitable. If equity markets begin to lose value, US Small Cap Growth ETFs will certainly be impacted, as the performance of these ETFs correlate with general market conditions. Still, investors should expect strong returns from ETFs in this sector for the foreseeable future.
Symbols: VBK, IWO, IJT, IWO, IWM, IWR, IWS, IWF, IWN, IWB, IWD
Tickers: (NYSE: VBK) (NYSE: IWO) (NYSE: IJT) (NYSE: IWO) (NYSE: IWP) (NYSE: IWM) (NYSE: IWR) (NYSE: IWS) (NYSE: IWF) (NYSE: IWN) (NYSE: IWB) (NYSE: IWD)
Disclosure: MyPlanIQ does not have any business relationship with the company or companies mentioned in this article. It does not set up their retirement plans. The performance data of portfolios mentioned above are obtained through historical simulation and are hypothetical.
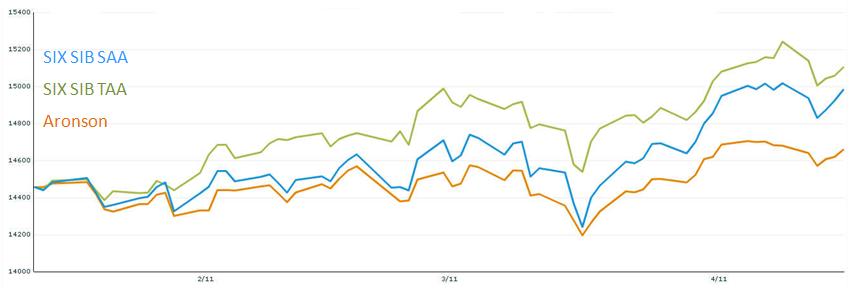
- REIT and Commodities In Simple Six Fund Portfolio Shows Up Aronson's Lazy Portfolio
04/20/2011
The incidents in Japan, the Middle East and even as far back as New Orleans teach us the danger of living on borrowed time, the reactors, the governments the levees keeping things going -- just one more year. The temptation to delay until next time is very seductive until disaster strikes and the cost to repair, dwarfs the cost to prevent. Many working people put off their retirement investing -- just one more year until it becomes a "hair on fire" problem -- which it now is for baby boomers for whom retirement is a near and present danger.
We continue to examine luminary portfolios to see what we can learn and use to further our investment portfolios.
Ted Aronson and his AJO Partners manage about $25 billion of institutional assets. Aronson puts his family's taxable money in this well-diversified portfolio of no-load index funds.
Fund Weight Ticker ETF US Equities 40% VFINX, VEXMX, VISGX, VTSMX, VISXX VTI, TMW, VBK, VBR International Equity 20% VPACX, VEURX VEA Emerging Markets 10% VEIEX EEM US Bonds 30% VIPSX, VUSTX, VWEHX TIP, LQD, HYG
This is a well diversified four asset class portfolio with an aggressive profile. The US equities are broadly diversified. Asia Pacific is put above Europe for developed markets. There is a diversified set of fixed income with VWEHX and VUSTX being relatively high risk. The long term treasury bond has proved to be a good diversifier in recent history -- today all bonds are under pressure so this may be less true.
The US component is possibly over-weighted and emerging markets could be increased or, even better, some real estate assets could be added.This portfolio was last reviewed at the end of the year and we now re-examine performance over the last three months as we see markets changing and inflation becoming more of a present reality.
This lazy portfolio will be compared with six asset class SIB to examine the returns of four and six asset class portfolios
Portfolio Performance Comparison
Portfolio/Fund Name 1Yr AR 1Yr Sharpe 3Yr AR 3Yr Sharpe 5Yr AR 5Yr Sharpe Aronson Original 6% 74% 2% 14% 3% 16% Six Core Asset ETF Benchmark Tactical Asset Allocation Moderate 10% 71% 9% 73% 13% 91% Six Core Asset ETF Benchmark Strategic Asset Allocation Moderate 13% 103% 3% 20% 7% 35% full comparison
The Aronson portfolio has four asset classes missing out on REIT and commodities. The performance over the last five years has not been exceptional with the Simple SIB able to beat it across the board.Over the last three months, REIT and commodities have been in favor and having neither has had an impact on the Aronson returns.Takeaways- The Aronson lazy portfolio has moderate returns that can be beaten
- Having broader diversification pays off as market conditions change
- ETFs can readily be used to implement these portfolios with good performance
- A 10% spread over five years means that it’s worth looking at alternatives
Disclosure:MyPlanIQ does not have any business relationship with the company or companies mentioned in this article. It does not set up their retirement plans. The performance data of portfolios mentioned above are obtained through historical simulation and are hypothetical.The incidents in Japan, the Middle East and even as far back as New Orleans teach us the danger of living on borrowed time, the reactors, the governments the levees keeping things going -- just one more year. The temptation to delay until next time is very seductive until disaster strikes and the cost to repair, dwarfs the cost to prevent. Many working people put off their retirement investing -- just one more year until it becomes a "hair on fire" problem -- which it now is for baby boomers for whom retirement is a near and present danger.
Exchange Tickers: (NYSE: VFINX), (NYSE: VEXMX), (NYSE: VISGX), (NYSE: VTSMX), (NYSE: VISXX), (NYSE: VTI), (NYSE: TMW), (NYSE: VBK), (NYSE: VBR), (NYSE: VPACX), (NYSE: VEURX), (NYSE: VEA), (NYSE: VEIEX), (NYSE: EEM), (NYSE: VIPSX), (NYSE: VUSTX), (NYSE: VWEHX), (NYSE: TIP), (NYSE: LQD), (NYSE: HYG)
- REIT and Commodities In Simple Six Fund Portfolio Shows Up Aronson's Lazy Portfolio
04/19/2011
The incidents in Japan, the Middle East and even as far back as New Orleans teach us the danger of living on borrowed time, the reactors, the governments the levees keeping things going -- just one more year. The temptation to delay until next time is very seductive until disaster strikes and the cost to repair, dwarfs the cost to prevent. Many working people put off their retirement investing -- just one more year until it becomes a "hair on fire" problem -- which it now is for baby boomers for whom retirement is a near and present danger.
We continue to examine luminary portfolios to see what we can learn and use to further our investment portfolios.
Ted Aronson and his AJO Partners manage about $25 billion of institutional assets. Aronson puts his family's taxable money in this well-diversified portfolio of no-load index funds.
Fund Weight Ticker ETF US Equities 40% VFINX, VEXMX, VISGX, VTSMX, VISXX VTI, TMW, VBK, VBR International Equity 20% VPACX, VEURX VEA Emerging Markets 10% VEIEX EEM US Bonds 30% VIPSX, VUSTX, VWEHX TIP, LQD, HYG
This is a well diversified four asset class portfolio with an aggressive profile. The US equities are broadly diversified. Asia Pacific is put above Europe for developed markets. There is a diversified set of fixed income with VWEHX and VUSTX being relatively high risk. The long term treasury bond has proved to be a good diversifier in recent history -- today all bonds are under pressure so this may be less true.
The US component is possibly over-weighted and emerging markets could be increased or, even better, some real estate assets could be added.This portfolio was last reviewed at the end of the year and we now re-examine performance over the last three months as we see markets changing and inflation becoming more of a present reality.
This lazy portfolio will be compared with six asset class SIB to examine the returns of four and six asset class portfolios
Portfolio Performance Comparison
Portfolio/Fund Name 1Yr AR 1Yr Sharpe 3Yr AR 3Yr Sharpe 5Yr AR 5Yr Sharpe Aronson Original 6% 74% 2% 14% 3% 16% Six Core Asset ETF Benchmark Tactical Asset Allocation Moderate 10% 71% 9% 73% 13% 91% Six Core Asset ETF Benchmark Strategic Asset Allocation Moderate 13% 103% 3% 20% 7% 35% full comparison
The Aronson portfolio has four asset classes missing out on REIT and commodities. The performance over the last five years has not been exceptional with the Simple SIB able to beat it across the board.Over the last three months, REIT and commodities have been in favor and having neither has had an impact on the Aronson returns.Takeaways- The Aronson lazy portfolio has moderate returns that can be beaten
- Having broader diversification pays off as market conditions change
- ETFs can readily be used to implement these portfolios with good performance
- A 10% spread over five years means that it’s worth looking at alternatives
Disclosure:MyPlanIQ does not have any business relationship with the company or companies mentioned in this article. It does not set up their retirement plans. The performance data of portfolios mentioned above are obtained through historical simulation and are hypothetical.The incidents in Japan, the Middle East and even as far back as New Orleans teach us the danger of living on borrowed time, the reactors, the governments the levees keeping things going -- just one more year. The temptation to delay until next time is very seductive until disaster strikes and the cost to repair, dwarfs the cost to prevent. Many working people put off their retirement investing -- just one more year until it becomes a "hair on fire" problem -- which it now is for baby boomers for whom retirement is a near and present danger.Symbols: VFINX, VEXMX, VISGX, VTSMX, VISXX, VTI, TMW, VBK, VBR, VPACX, VEURX, VEA, VEIEX, EEM, VIPSX, VUSTX, VWEHX, TIP, LQD, HYG - Armstrong's Informed Investor Lazy Portfolio Feels The Commodities Pain
04/18/2011
The incidents in Japan, the Middle East and even as far back as New Orleans teach us the danger of living on borrowed time, the reactors, the governments the levees keeping things going -- just one more year. The temptation to delay until next time is very seductive until disaster strikes and the cost to repair, dwarfs the cost to prevent. Many working people put off their retirement investing -- just one more year until it becomes a "hair on fire" problem -- which it now is for baby boomers for whom retirement is a near and present danger.
We continue to examine luminary portfolios to see what we can learn and use to further our investment portfolios.
Frank Armstrong, author of The Informed Investor, proposed this portfolio for an MSN Money article. The two key points of the portfolio are that it has four asset classes (US, International, REIT, Bonds) and relies on market indices rather than active management. The portfolio uses index funds because index funds eliminate manager risk. It overweights small-cap stocks as small-cap stocks have historically outperformed large caps stocks. The portfolio has a strong value tilt, based on the theory that, over the long haul, beaten-down stocks will perform better than high-flying growth stocks.
This should be a low cost, well performing portfolio.
The fund selection for testing the strategy is listed below with the ETF alternatives:
- 9.25% in Vanguard Small Cap Value VISVX (SCZ)
- 9.25% in Vanguard Value VIVAX (SPY, IYY)
- 6.25% in Vanguard Small-Cap Growth VISGX (VBK)
- 6.25% in Vanguard 500 Index VFINX (IVW)
- 31% in Vanguard Total International Stock VGTSX (EFA)
- 8% in Vanguard REIT VGSIX (IYR, VNQ, RWX)
- 30% in Vanguard Short-Term Bond VBISX (BND, AGG)
Things to note about the portfolio:
- This is designed as a lazy portfolio with limited rebalancing specified
- 31% in US equities is significant with a mix of large and small cap stocks
- With 70% in equities, this is a growth portfolio
- REIT is possibly underweighted
- There is no commodity asset class
The chart and table below show the historical performance of moderate model portfolios employing strategic and tactical asset allocation strategies. For comparison purpose, we also include the moderate model portfolios of a typical 6 asset SIB (Simpler Is Better) plan . This SIB plan has the following candidate index funds and their ETFs equivalent: US Equity: SPY or VTI
Commodity: DBC
Foreign Equity: EFA or VEU
REITs: IYR or VNQ or ICF
Emerging Market Equity: EEM or VWO
Fixed Income: AGG or BND
Portfolio Performance Comparison
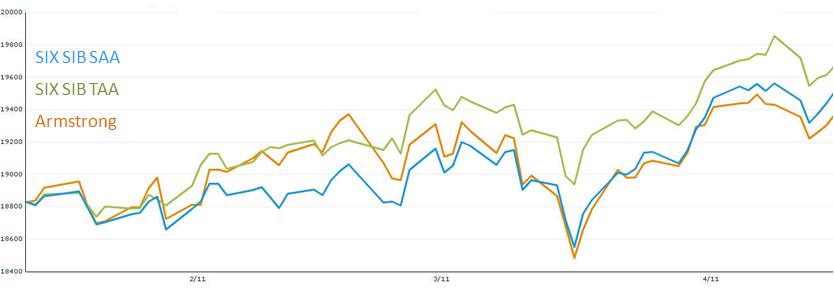
Portfolio/Fund Name 1Yr AR 1Yr Sharpe 3Yr AR 3Yr Sharpe 5Yr AR 5Yr Sharpe Armstrong Original 10% 66% 4% 17% 5% 20% Six Core Asset ETF Benchmark Tactical Asset Allocation Moderate 10% 71% 9% 73% 13% 91% Six Core Asset ETF Benchmark Strategic Asset Allocation Moderate 13% 103% 3% 20% 7% 35% A detailed comparison can be found here
Takeaways
-
2010 was a good year for lazy portfolios and as we continue through 2011while equities are still performing well, not having a commodities option hurts returns
-
TAA has benefits in terms of being able to stay away from some area such as European equities
-
Index funds continue to show good results against managed funds
-
Larger asset class plans have the benefit of stability and good returns
Disclosure: MyPlanIQ does not have any business relationship with the company or companies mentioned in this article. It does not set up their retirement plans. The performance data of portfolios mentioned above are obtained through historical simulation and are hypothetical.
Symbols: VISVX, SCZ, VIVAX, SPY, IYY, VISGX, VBK, VFINX, IVW, VGTSX, EFA, VGSIX, IYR, VNQ, RWX, BND, AGG, DBC, VEU, ICF, EEM, VWO - Schwab Mutual Funds Beat out ETFs
04/06/2011
- Schwab Select ETF Plan Has Bright Prospects
04/06/2011
- National Semiconductor Provides Good Funds in Their Retirement Plan
04/04/2011
- MidAmerican Energy Company's 401K Plan: More Diversification Needed
03/31/2011
- Online Pioneer Amazon.com Can Expand Its 401K Plan for More Diversification
03/22/2011
- RWO, RWR Replace VNQ in the Six Asset Portfolio
03/20/2011
- Swensen Six Asset Lazy Portfolio Review Exhibits Different Q1 Behavior
03/19/2011
- What Do Japan and Libya Tell Us About Retirement Investing?
03/17/2011
- Schwab ETF Select List Plan Offers Diversification and High Quality Fund Selection
03/16/2011
- Starbucks Should Expand Its 401K Retirement Plan, Just As What It Did in Their Business
03/11/2011
- Does Adding Three US Funds To A Simple Six Asset Portfolio Make a Difference?
03/10/2011
- Initiating Tracking of US Subclasses
02/22/2011
- Initiating Tracking of US Subclasses
02/22/2011
- E-Trade ETF Plan Hits Most of the High Notes
02/16/2011
- RSP Leads US Large Cap Blend Equities
02/14/2011
- Aflac Incorporated 401(k) Savings and Profit Sharing Plan Report On 12/03/2010
12/03/2010
This report reviews Aflac Incorporated 401(k) Savings and Profit Sharing Plan plan. We will discuss the investment choices and present the plan rating by MyPlanIQ. Current economic and market conditions are discussed in the context of the investment portfolios in the plan. We will then show how participants in Aflac Incorporated 401(k) Savings and Profit Sharing Plan can achieve reasonable investment results using asset allocation strategies.
Plan Review and Rating
AFLAC Inc (Ticker:AFL) has the "Aflac Incorporated 401(k) Savings and Profit Sharing Plan".
Aflac Incorporated 401(k) Savings and Profit Sharing Plan's 401K plan consists of 11 funds. These funds enable participants to gain exposure to 3 major assets: US Equity, Foreign Equity, Fixed Income. The list of minor asset classes covered:
Foreign Large Blend: EFA, VEU, GWL, PFA
Intermediate-term Bond: AGG, CIU, BIV, BND
Large Blend: IVV, IYY, IWV, VTI, VV, SPY, DLN, RSP, SCHX
Large Growth: IVW, IWZ, JKE, VUG, ELG, QQQQ, RPG, SCHG
Large Value: IVE, IWW, JKF, VTV, ELV, PWV, RPV, SCHV
Mid-cap Growth: IJK, IWP, VOT, EMG, PWJ, RFG, UKW
Moderate Allocation: AOM
Small Growth: IJT, IWO, JKK, VBK, DSG, PWT, RZG, UKK
As of Dec 2, 2010, this plan investment choice is rated as based on MyPlanIQ Plan Rating methodology that measures the effectiveness of a plan's available investment funds. It has the following detailed ratings:
Diversification -- Rated as (35%)
Fund Quality -- Rated as (33%)
Portfolio Building -- Rated as (36%)
Overall Rating: (35%)Current Economic and Market Conditions
We have experienced an uncertain 2010: plenty of worries on whether the US economy will climb out of the great recession and recover.
- The Federal Reserve embarked on Quantitative Easing II (QE2) to stimulate the economy.
- The housing market is still at its low but largely stabilized.
- The unemployment rate is stuck at 9%.
Americans continue to face an uncertain future, given (among others) the high unemployment rate, large federal and local government debts and global trade imbalance. With such an economic backdrop, the stock and debt markets are going to be volatile. Despite this, markets have been resilient and appear positioned to rebound.
In this market it is even more critical to properly diversify and respond market changes. MyPlanIQ offers two asset allocation strategies: strategic and tactical asset allocation strategies ( SAA and TAA for participants in Aflac Incorporated 401(k) Savings and Profit Sharing Plan).
Strategic Asset Allocation is based on well known modern portfolio theory and its key features include: diversification, proper fund selection and periodically re-balancing.
Tactical Asset Allocation works on a diversified array of assets provided by funds in a plan and adjusts asset mixes based on market conditions such as asset price momentum utilized by TAA.
Portfolio Discussions
The chart and table below show the historical performance of moderate model portfolios employing strategic and tactical asset allocation strategies. For comparison purpose, we also include the moderate model portfolios of a typical 3 asset SIB (Simpler Is Better) plan . This SIB plan has the following candidate index funds and their ETFs equivalent:
US Equity: (SPY or VTI)
Foreign Equity: (EFA or VEU)
Fixed Income: (AGG or BND)
Performance chart (as of Dec 2, 2010)Performance table (as of Dec 2, 2010)
Portfolio Name 1Yr AR 1Yr Sharpe 3Yr AR 3Yr Sharpe 5Yr AR 5Yr Sharpe Aflac Incorporated 401(k) Savings and Profit Sharing Plan Tactical Asset Allocation Moderate 4% 34% 5% 64% 8% 81% Aflac Incorporated 401(k) Savings and Profit Sharing Plan Strategic Asset Allocation Moderate 10% 100% 2% 8% 6% 31% Three Core Asset ETF Index Funds Tactical Asset Allocation Moderate -4% -35% 1% 9% 4% 27% Three Core Asset ETF Index Funds Strategic Asset Allocation Moderate 9% 60% -0% -3% 4% 13% Currently, asset classes in US Equity (SPY,VTI), Foreign Equity (EFA,VEU) and Fixed Income (AGG,BND) are doing relatively well. These asset classes are available to Aflac Incorporated 401(k) Savings and Profit Sharing Plan participants.
To summarize, Aflac Incorporated 401(k) Savings and Profit Sharing Plan plan participants can achieve reasonable investment returns by adopting asset allocation strategies that are tailored to their risk profiles.
Symbols: AFL , SPY , VTI , EFA , VEU , AGG , BND , AOM , CIU , BIV , GWL , PFA , IVE , IWW , JKF , VTV , ELV , PWV , RPV , SCHV , IVV , IYY , IWV , VV , DLN , RSP , SCHX , IVW , IWZ , JKE , VUG , ELG , QQQQ , RPG , SCHG , IJK , IWP , VOT , EMG , PWJ , RFG , UKW , IJT , IWO , JKK , VBK , DSG , PWT , RZG , UKK
- ALLERGAN, INC. SAVINGS AND INVESTMENT PLAN Report On 12/03/2010
12/03/2010
- Apartment Investment and Management Company 401(k) Retirement Plan Report On 12/03/2010
12/03/2010
- Abercrombie Fitch Co. Savings and Retirement Plan Report On 12/03/2010
12/03/2010
- Apache Design Solutions 401K Report On 12/03/2010
12/03/2010
- Allegheny Ludlum Corporation Personal Retirement and 401(k) Savings Account Plan Report On 12/03/2010
12/03/2010
- ALLEGHENY ENERGY EMPLOYEE STOCK OWNERSHIP AND SAVINGS PLAN Report On 12/03/2010
12/03/2010
- BAKER 401(k) PLAN Report On 12/03/2010
12/03/2010
- PEABODY WESTERN-UMWA 401(K) PLAN Report On 12/03/2010
12/03/2010
- Peabody Investments Corp.Employee Retirement Account Report On 12/03/2010
12/03/2010
- Capital Accumulation Plan of The Chubb Corporation Report On 12/03/2010
12/03/2010
- CEPHALON, INC. 401(k) PROFIT SHARING PLAN Report On 12/03/2010
12/03/2010
- CVS CAREMARK CORPORATION AND AFFILIATED COMPANIES Report On 12/03/2010
12/03/2010
- EQT CORPORATION SAVINGS AND PROTECTION PLAN Report On 12/03/2010
12/03/2010
- TD Ameritrade Commission Free ETFs Report On 12/07/2010
12/07/2010
- Qualcomm 401(k) Plan Report On 12/07/2010
12/07/2010
- Tiffany Co. Employee Profit Sharing and Retirement Savings Plan Report On 03/21/2011
03/21/2011