 |
Vanguard ETF: |  |
7.4%* |
|
Diversified Core: | |
8.1%* |
|
Six Core Asset ETFs: | |
7.3%* |
Articles on IFGL
- International REIT Rapidly Becoming A Key Area For Investors
04/21/2011
Global REIT (Real Estate Investment Trust) markets showed major growth in 2007 capturing $900 billion of equities capitalization according to the stats of National Association of Real Estate Investment Trusts (NARIET). Previously U.S and Australia were the major market but today REITs are adopted by many foreign countries. In fact a REIT portfolio should have a strong international flavor and as this gives you better diversification offering better risk adjusted returns.
These are the major country international REITS
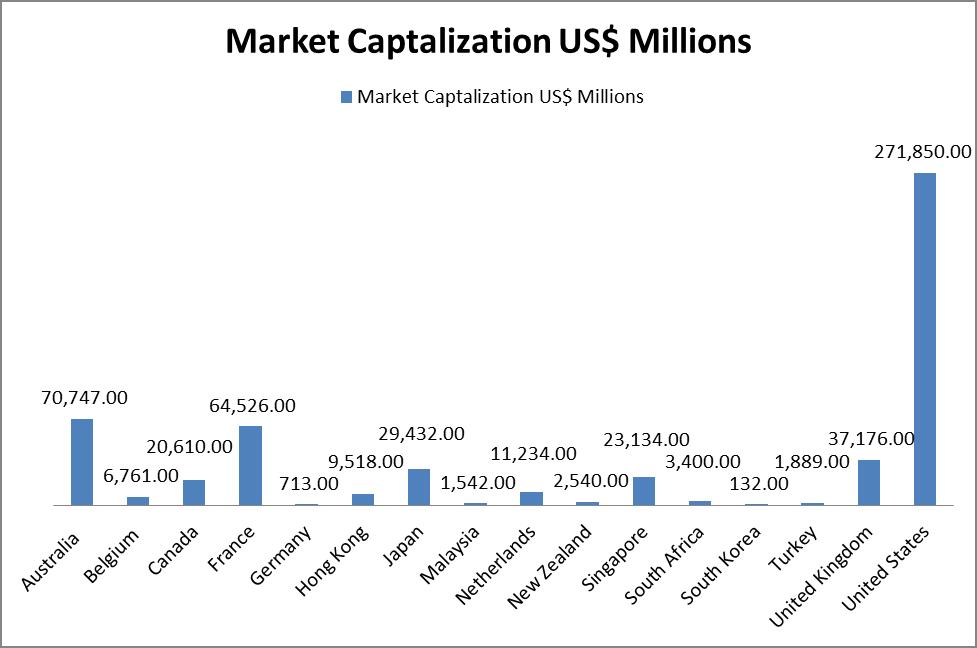
(Source: Ernst & young – Global Real investment trust report 2010)
In the recent recession where investors dumped their equity positions and unemployment accelerated, international REITS did not have such a sever shock. Even with the global economic crisis in the past years, we have only seen a few REIT bankruptcies. Recent development in Japan and U.S show the true growth prospect of REIT. Banks have worked with REITs to modify or extend maturities on existing loans rather than force sales in a demanding market.
We show a table of the leading international REIT ETF’s.
Description
Symbol
1 Yr
3 Yr
5 Yr
Avg. Volume(K)
1 Yr Sharpe
SPDR Dow Jones Intl Real Estat
20.47%
-5.23%
NA
385
88.47%
SPDR Dow Jones Global Real Estate
19.99%
NA
NA
76
104.5%
WisdomTree International Real Estate
18.39%
-5.85%
NA
32
82.37%
iShares S&P Dev ex-US Property
11.25%
-5.94%
NA
25
52.74%
iShares FTSE EPRA/NAREIT Dev Real Estate
8.59%
-7.37%
NA
91
42.21%
Most of the REITS have similar results except IFGL and WPS. RWX is the best with a one year yield of 20.47%, best of the three year returns (although not good) and the highest volume. RWX volumes are also very good but all these ETF are new and none them has 5 year yields.
Ernst and young research stats clearly shows the International REITS diversification
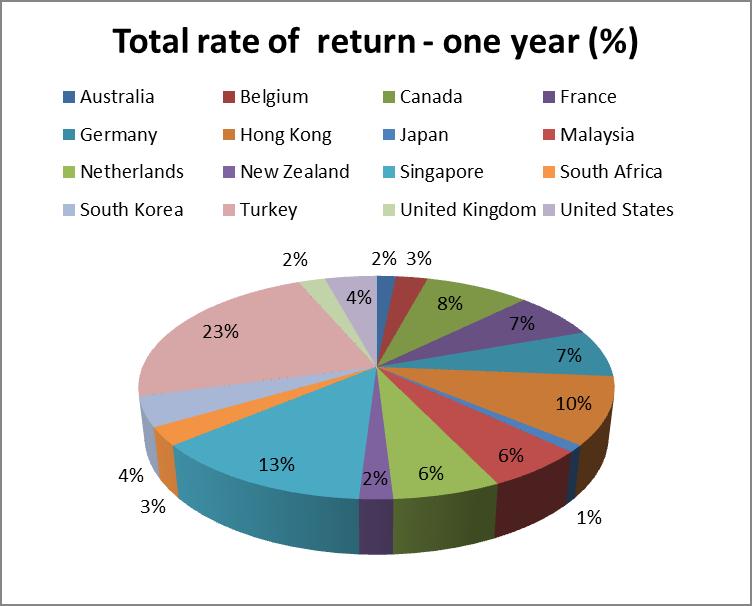
(Source: Ernst & young – Global Real investment trust report 2010)
Government also help REITs – for example, U.S REITs are given special tax status to avoid corporate taxes, the corporates will be exempt from taxes if they distribute their 90% of income by way of dividend to investors.
In the UK, the government encourages REITs to own residential property. In Germany government are rescinding their rules of prohibiting REITs from investing in residential property not only this they also provide an incentive of 50% exemption on capital gains tax for institutional and corporate property owners that sell assets to REITs.
In Japan the government also provides a facility for J-REITs to purchase or re?nance bonds coming due and has thereby shored up investor con?dence.
International REITs provides diversity in the real estate sector. By diversifying the portfolio with international REITs we can not only hedge the risk but we can increase our returns too. REITS are a necessary element of a portfolio. Without REITs ETF we lose a major growth opportunity as increasing world population and the demand for property. With the appropriate diversification from International REIT we can increase the potential for better risk adjusted returns.
Symbols: RWX, RWO, DRW, WPS, IFGL
Tickers: (NYSE: RWX), (NYSE: RWO), (NYSE: DRW), (NYSE: WPS), (NYSE: IFGL)
Disclosure:
MyPlanIQ does not have any business relationship with the company or companies mentioned in this article. It does not set up their retirement plans. The performance data of portfolios mentioned above are obtained through historical simulation and are hypothetical - Schwab Mutual Funds Beat out ETFs
04/06/2011
l
Retirement investing is a "hair on fire" problem -- especially for baby boomers for whom retirement is a near and present danger. There is a real lack of consistent, unbiased information that a retiree can use to help improve risk adjusted returns. Blogger Jenny Hollingworth has been teaching herself about investing and has come to the point where she is going to choose a plan and make her first investments.
In her recent post New Steps she sorted through a list of alternatives and chose the Schwab OneSource Select List Funds.
The reason for her choice was:
- The highest possible rating for each plan is 5 stars. So I bypassed anything that didn’t have 5 (because really, why go for less?)
- Picked out a name I knew: Schwab. Specifically: Schwab OneSource Select List Funds. I selected it.
- This is an application to Charles Schwab's OneSource Select List mutual funds. These funds are No Load and No Transaction Fee (NTF) mutual funds. Based on Schwab's policy, the no load NTF funds have 90 days redemption fee period. As of 1/1/2010, there are total 140 OneSource Select List funds available from Schwab.
We are going to review the Schwab OneSource Select List Funds to see whether she chose a good plan. The plan consists of 137 funds. These funds enable participants to gain exposure to 6 major assets: US Equity, Commodity, Foreign Equity, REITs, Emerging Market Equity, Fixed Income.
Asset Class Ticker Name LARGE VALUE AAGPX American Beacon Lg Cap Value Inv Foreign Large Value AAIPX American Beacon Intl Equity Inv Retirement Income AANPX American Beacon Retire Inc & Apprec Inv High Yield Muni ABHYX American Century High-Yield Muni Inv Inflation-Protected Bond ACITX American Century Infl-Adj Bond Inv Muni National Long ACLVX American Century Long-Term Tax-Free Inv MID-CAP VALUE ACMVX American Century Mid Cap Value Inv Conservative Allocation AONIX American Century One Choice: Vry Cnsrv I MID-CAP VALUE ARDEX Aston/River Road Dividend All Cap Val N Target Date 2011-2015 ARFIX American Century LIVESTRONG 2015 Inv Retirement Income ARTOX American Century LIVESTRONG Inc Inv Target Date 2021-2025 ARWIX American Century LIVESTRONG 2025 Inv Target Date 2031-2035 ARYIX American Century LIVESTRONG 2035 Inv SMALL VALUE AVPAX American Beacon Small Cp Val Inv EUROPE STOCK AXEAX Threadneedle European Equity A Muni National Interm BMBSX Baird Intermediate Muni Bd Inv Technology BOGSX Black Oak Emerging Technology Small Growth BSCFX Baron Small Cap Moderate Allocation BUFBX Buffalo Balanced Technology BUFTX Buffalo Science & Technology DIVERSIFIED EMERGING MKTS CEMVX Causeway Emerging Markets Investor MID-CAP BLEND CHTTX Aston/Optimum Mid Cap N Intermediate Government CPTNX American Century Government Bond Inv Small Growth CSMVX Century Small Cap Select Inv REAL ESTATE CSRSX Cohen & Steers Realty Shares Long-Short CVSIX Calamos Market Neutral Income A SMALL BLEND DISSX Dreyfus Small Cap Stock Index Bank Loan EABLX Eaton Vance Floating Rate Adv Conservative Allocation EXDAX Manning & Napier Pro-Blend Cnsrv Term S Foreign Large Blend EXWAX Manning & Napier World Opportunities A Moderate Allocation FAGSX First American Strat Growth Allc A Financial FBRSX FBR Small Cap Financial ULTRASHORT BOND FEUGX Federated Adjustable Rate Secs Instl Intermediate Government FICMX Federated Income Instl Muni National Interm FIMTX Federated Intermediate Municipal Instl LARGE BLEND FMIHX FMI Large Cap Long-Short FMLSX Wasatch-1st Source Long/Short SHORT GOVERNMENT FSGVX Federated US Govt 1-3 Yr Instl Muni Short FSHIX Federated Shrt-Interm Dur Muni Instl Short-Term Bond FSTIX Federated Short-Term Income Instl Intermediate-Term Bond FTRFX Federated Total Return Bond Instl Svc SMALL BLEND GABSX Gabelli Small Cap Growth AAA Communications GABTX GAMCO Global Telecommunications AAA LARGE GROWTH HCAIX Harbor Capital Appreciation Inv Foreign Large Blend HIINX Harbor International Inv WORLD STOCK HLMGX Harding Loevner Global Equity Advisor Foreign Large Growth HLMNX Harding Loevner International Equity Inv Equity Energy ICENX ICON Energy S China Region ICHKX Guinness Atkinson China & Hong Kong LARGE VALUE INDZX RiverSource Diversified Equity Inc A Moderate Allocation JABAX Janus Balanced T Health JAGLX Janus Global Life Sciences T LARGE GROWTH JAMRX Janus Research T Small Growth JATTX Janus Triton T Foreign Large Blend JETAX Artio International Equity II A Target Date 2021-2025 JNSAX JPMorgan SmartRetirement 2025 A LARGE BLEND JRMSX INTECH Risk-Managed Core T Target Date 2011-2015 JSFAX JPMorgan SmartRetirement 2015 A Target Date 2026-2030 JSMAX JPMorgan SmartRetirement 2030 A Target Date 2016-2020 JTTAX JPMorgan SmartRetirement 2020 A LARGE BLEND JUEAX JPMorgan US Equity A LARGE VALUE JVLAX JHancock3 Disciplined Value A Small Growth KGSCX Kalmar Growth-with-Value Small Cap LARGE GROWTH LGILX Laudus Growth Investors US Large Cap Gr WORLD BOND LIFNX Laudus Mondrian Intl Fixed Income Foreign Large Blend LISOX Lazard Intl Strategic Equity Open Multisector Bond LSBRX Loomis Sayles Bond Retail DIVERSIFIED PACIFIC/ASIA MAPIX Matthews Asia Pacific Equity Income PACIFIC/ASIA EX-JAPAN STK MAPTX Matthews Pacific Tiger Investor China Region MCHFX Matthews China Investor Muni National Interm MITFX Marshall Intermediate Tax-Free Inv JAPAN STOCK MJFOX Matthews Japan Investor Foreign Large Blend MKIEX McKee International Equity Instl DIVERSIFIED PACIFIC/ASIA MPACX Matthews Asia Pacific Investor High Yield Bond MWHYX Metropolitan West High Yield Bond M Short-Term Bond MWLDX Metropolitan West Low Duration Bond M Intermediate-Term Bond MWTRX Metropolitan West Total Return Bond M MID-CAP BLEND NMMCX Northern Multi-Manager Mid Cap SMALL VALUE NOSGX Northern Small Cap Value Muni National Long NOTEX Northern Tax-Exempt Small Growth NSPAX ING Small Cap Opportunities A Foreign Small/Mid Value OAKEX Oakmark International Small Cap I WORLD STOCK OAKGX Oakmark Global I COMMODITIES BROAD BASKET PCRDX PIMCO Commodity Real Ret Strat D Emerging Markets Bond PEMDX PIMCO Emerging Markets Bond D LARGE BLEND PEOPX Dreyfus S&P 500 Index WORLD BOND PFODX PIMCO Foreign Bond (USD-Hedged) D Intermediate-Term Bond PGBOX JPMorgan Core Bond A Multisector Bond PONDX PIMCO Income D LARGE BLEND PRBLX Parnassus Equity Income - Inv Inflation-Protected Bond PRRDX PIMCO Real Return D SMALL VALUE PSOAX JPMorgan Small Cap Value A Intermediate-Term Bond PTTDX PIMCO Total Return D SMALL BLEND RYTFX Royce Total Return Svc Intermediate-Term Bond SAMIX RidgeWorth Intermediate Bond I Foreign Large Blend SICNX Schwab International Core Equity Inst Foreign Large Blend SIEIX RidgeWorth Intl Equity Index I ULTRASHORT BOND SIGVX RidgeWorth US Gov Sec Ultra-Short Bd I Target Date 2031-2035 SRJAX JPMorgan SmartRetirement 2035 A DIVERSIFIED EMERGING MKTS SSEMX SSgA Emerging Markets Instl High Yield Bond STHTX RidgeWorth High Income I Muni National Interm STTBX RidgeWorth Investment Grade T/E Bond I LARGE BLEND SWANX Schwab Core Equity Inv Global Real Estate SWASX Schwab Global Real Estate Select Target Date 2026-2030 SWDRX Schwab Target 2030 LARGE VALUE SWDSX Schwab Dividend Equity Financial SWFFX Schwab Financial Services Target Date 2011-2015 SWGRX Schwab Target 2015 Intermediate Government SWGSX Schwab GNMA Long-Short SWHEX Schwab Hedged Equity Health SWHFX Schwab Health Care Target Date 2021-2025 SWHRX Schwab Target 2025 Intermediate-Term Bond SWIIX Schwab Premier Income Instl Foreign Large Blend SWISX Schwab International Index Retirement Income SWKRX Schwab Monthly Income Enh Payout Retirement Income SWLRX Schwab Monthly Income Max Payout LARGE GROWTH SWLSX Schwab Large-Cap Growth Foreign Large Growth SWMIX Laudus International MarketMasters Sel Small Growth SWMSX Laudus Small-Cap MarketMasters Select Muni National Interm SWNTX Schwab Tax-Free Bond Moderate Allocation SWOBX Schwab Balanced Inv LARGE BLEND SWPPX Schwab S&P 500 Index SMALL BLEND SWSSX Schwab Small Cap Index LARGE GROWTH TGCNX TCW Select Equities N Mid-Cap Growth TGDNX TCW Growth Equities N EQUITY PRECIOUS METALS TGLDX Tocqueville Gold LARGE BLEND TICRX TIAA-CREF Social Choice Eq Retail LARGE GROWTH TIRTX TIAA-CREF Large-Cap Growth Retail LARGE GROWTH TWCGX American Century Growth Inv Muni National Interm TWTIX American Century Interm-T Tx-Fr Bd Inv SHORT GOVERNMENT TWUSX American Century Short-Term Govt Inv LARGE VALUE TWVLX American Century Value Inv Foreign Large Value TWWDX Thomas White International Foreign Large Growth UMBWX Scout International SMALL VALUE VSFAX Federated Clover Small Value A Mid-Cap Growth WTMGX Westcore MIDCO Growth LARGE VALUE YAFFX Yacktman Focused Asset Class Number of funds Balanced Fund 21 REITs 2 Fixed Income 34 Commodity 1 Sector Fund 9 Foreign Equity 18 Emerging Market Equity 7 US Equity 41 Other 4 Total 137
As of Apr 5, 2011, this plan investment choice is rated as above average based on MyPlanIQ Plan Rating methodology that was designed to measure how effective a plan's available investment funds are . It has the following detailed ratings:Diversification -- Rated as great (98%)
Fund Quality -- Rated as average (54%)
Portfolio Building -- Rated as great (86%)
Overall Rating: above average (80%)Portfolio Discussions
The chart and table below show the historical performance of moderate model portfolios employing strategic and tactical asset allocation strategies. For comparison purpose, we also include the moderate model portfolios of a typical 6 asset SIB (Simpler Is Better) plan . This SIB plan has the following candidate index funds and their ETFs equivalent:
US Equity: SPY or VTI
Commodity: DBC
Foreign Equity: EFA or VEU
REITs: IYR or VNQ or ICF
Emerging Market Equity: EEM or VWO
Fixed Income: AGG or BND
Performance chart (as of Apr 5, 2011)Performance table (as of Apr 5, 2011)
Portfolio Name 1Yr AR 1Yr Sharpe 3Yr AR 3Yr Sharpe 5Yr AR 5Yr Sharpe Schwab OneSource Select List Funds Tactical Asset Allocation Moderate 13% 106% 10% 91% 13% 110% Schwab OneSource Select List Funds Strategic Asset Allocation Moderate 12% 152% 4% 32% 7% 52% Six Core Asset ETF Benchmark Tactical Asset Allocation Moderate 10% 81% 9% 82% 13% 89% Six Core Asset ETF Benchmark Strategic Asset Allocation Moderate 14% 121% 4% 20% 7% 34% With six asset classes and a wide number of funds, the returns beat the six asset class benchmark. With high scores in all categories, this plan delivers portfolios that have produced strong historical returns.
Symbols: SPY, VTI, EFA, VEU, EEM, VWO, IYR, VNQ, ICF, AGG, BND, DBC, HYG, JNK, PHB, AOM, AOK, CIU, BIV, ITM, MUB, TFI, PZA, MLN, IYH, IXJ, VHT, XBI, PBE, DBR, RYH, EFG, IXP, PTE, DGG, LTL, MTK, PTF, DBT, RYT, ROM, GWL, PFA, IVE, IWW, JKF, VTV, ELV, PWV, RPV, SCHV, SCZ, EFV, PID, DWM, IYF, VFH, IPF, PFI, DRF, RYF, IFGL, RWX, TZE, TZG, TZI, TZO, TZL, IGOV, BWX, WIP, IVV, IYY, IWV, VV, DLN, RSP, SCHX, IOO, VT, SHY, SHV, VGSH, PLK, USY, IEV, VGK, PEF, DEB, IVW, IWZ, JKE, VUG, ELG, QQQQ, RPG, SCHG, IJJ, IWS, JKI, VOE, EMV, PWP, RFV, UVU, IJH, IWR, JKG, VO, MDY, EMM, PJG, DON, EZM, MVV, IJS, IWN, JKL, VBR, DSV, PWY, RZV, UVT, IJR, IWM, JKJ, VB, DSC, PJM, DES, SAA, UWM, SCHA, GMM, PXH, DEM, SCHE, GBF, LAG, PCY, CSJ, BSV, VCSH, ITE, IXC, IPW, DBE, RYE, DKA, IEI, VGIT, IJK, IWP, VOT, EMG, PWJ, RFG, UKW, IJT, IWO, JKK, VBK, DSG, PWT, RZG, UKK, TIP, DBP, EPP, VPL, GMF, PAF, AAXJ, DND, EWJ, JPP, PJO, DXJ, GSG, BIL
Disclosure:
MyPlanIQ does not have any business relationship with the company or companies mentioned in this article. It does not set up their retirement plans. The performance data of portfolios mentioned above are obtained through historical simulation and are hypothetical.
Originally from the UK, Jenny Hollingworth lives with her husband and two sons in Northern California. She is a wife, mother, writer, theatre director, coffee drinker, avid reader, keen walker, movie watcher, Jane Austen lover and observer of life, in no particular order. MyPlanIQ has no formal relationship with Jenny Hollingworth.
- Japan’s Disasters Slams the Market – What Happens to REIT Now?
03/22/2011
The recent slide in global stocks due to the triple disasters in Japan erased 2011 S&P gains. The MSCI world index has decline more than 6.77% this month all the tickers are flashing red. The Fed pledges it will continue the second round of quantitative easing by buying back more treasuries and keeping the interest rates low. The recovery is on its way but still time is needed especially in light of recent events. In addition, escalating tension in the Middle East along with the recent downgrading of Spain and Portugal by Standard & Poor’s adding downward pressure to the market. Risk is very visible at the moment.
This is an excellent time to discuss US REAL ESTATE INVESTMENT TRUST ETF’s (US REITS). With equities domestically and internationally under pressure, having an asset class that is uncorrelated with equities, can help lower risk and provide a hedge. US REITS have a total return around 17-20%. over the last 52 weeks. Please see the table of US REITS.
Description
Symbol
1 Yr
3 Yr
5 Yr
Avg. Volume(K)
1 Yr Sharpe
Vanguard REIT Index ETF
17.38%
1.23%
0.37%
1,735
97.45%
SPDR Dow Jones REIT
17.83%
0.3%
-1.17%
260
99.15%
iShares Dow Jones US Real Estate
17.51%
0.6%
-1.7%
7,165
103.34%
iShares Cohen & Steers Realty
20.25%
-1.24%
-1.8%
610
112.48%
The two top performers are:
Ø iShares Cohen & Steers Realty (ICF) with a return of around 20.25%
Ø SPDR Dow Jones REIT (RWR) with return of around 17.83%
Although the 52 weeks returns are strong, the shorter term returns shows a slowing in the momentum of REITS. Reviewing returns over time show that the US REITS are competing the Internationals REITS making it more better place for investment internationally and the show the strong fundamentals of US REITS.
LONG TERM US REITS POSITIONING:
REIT’s have enjoyed two good years of 28% returns. The key question is, “Will the rally will continue in the US REIT’s?” As long as the FED keeps interest rate low US REITS will continue to enjoy good but lower returns.. The long term of US REIT is positive and we can see further rise in the upcoming days.
Investors looking for high dividend yields also favored the REIT sector. Solid dividend payouts are arguably the biggest enticement for REIT investors as U.S. law requires REITs to distribute 90% of their annual taxable income in the form of dividends to shareholders.
Conclusion
Over the past week, the world index has dropped 6.7%. At the same time, US REITs have dropped around 2.3%. With a disaster on such an unprecedented scale as Japan, almost everything is going to be hit but having an asset class uncorrelated with equities gives us an alternative path to provide a hedge.
The crisis, as disastrous as it is at a human and ecological level, will have reducing impact on financial markets over time and we will likely see REITS return back into positive territory.
Disclosure:
MyPlanIQ does not have any business relationship with the company or companies mentioned in this article. It does not set up their retirement plans. The performance data of portfolios mentioned above are obtained through historical simulation and are hypothetical.
Symbols:VNQ,RWR,IYR,ICF,RWO,RWX,IFGL,DRW,WPS,
Exchange Symbols: (NYSE: vnq), (NYSE: rwr), (NYSE: iyr), (NYSE: icf), (NYSE: rwo), (NYSE: rwx), (NYSE: IFGL), (NYSE: drw), (NYSE: wps) - E-Trade ETF Plan Hits Most of the High Notes
02/16/2011
ETrade All-Star ETF plan has recently been announced as no/low cost ETF plans become increasingly widespread. The company has attempted to make their selection on criteria such as low expense ratio, tracking error, liquidity, style purity, underlying holdings, and how well the ETF represents the index it seeks to replicate. In addition, ETFs chosen are passively managed, have at least 6-months trading history and are sponsored by a well balanced investment firm.
The growth in number of ETFs are such that many of them are still new. In our analysis, we ignore ETF's that have less than one year's history which may negatively impact returns in the short term but, over time, they will come on-line and provide greater diversification.The plan consists of 40 funds giving exposure to 5 major assets: US Equity, Foreign Equity, REITs, Emerging Market Equity, Fixed Income.
Asset Class Ticker Name LARGE BLEND RSP Rydex S&P Equal Weight LARGE BLEND SPY SPDR S&P 500 LARGE GROWTH IWF iShares Russell 1000 Growth Index LARGE GROWTH MGK Vanguard Mega Cap 300 Gr Index ETF LARGE VALUE IWD iShares Russell 1000 Value Index LARGE VALUE DIA SPDR Dow Jones Industrial Average LARGE VALUE VYM Vanguard High Dividend Yield Indx ETF LARGE VALUE MGV Vanguard Mega Cap 300 Value Index ETF MID-CAP BLEND VO Vanguard Mid-Cap ETF Mid-Cap Growth VOT Vanguard Mid-Cap Growth ETF MID-CAP VALUE VOE Vanguard Mid-Cap Value ETF SMALL BLEND IWM iShares Russell 2000 Index Small Growth IWO iShares Russell 2000 Growth Index SMALL VALUE IWN iShares Russell 2000 Value Index Emerging Markets Bond EMB iShares JPMorgan USD Emerg Markets Bond Emerging Markets Bond PCY PowerShares Emerging Mkts Sovereign Debt High Yield Bond HYG iShares iBoxx $ High Yield Corporate Bd High Yield Bond JNK SPDR Barclays Capital High Yield Bond Inflation-Protected Bond TIP iShares Barclays TIPS Bond Intermediate Government IEI iShares Barclays 3-7 Year Treasury Bond Intermediate Government AGZ iShares Barclays Agency Bond Intermediate Government ITE SPDR Barclays Capital Interm Term Trs Intermediate-Term Bond AGG iShares Barclays Aggregate Bond Intermediate-Term Bond CFT iShares Barclays Credit Bond Intermediate-Term Bond BIV Vanguard Intermediate-Term Bond ETF Intermediate-Term Bond BND Vanguard Total Bond Market ETF LONG GOVERNMENT TLH iShares Barclays 10-20 Year Treasury Bd Long-Term Bond BLV Vanguard Long-Term Bond Index ETF SHORT GOVERNMENT SHY iShares Barclays 1-3 Year Treasury Bond Short-Term Bond BSV Vanguard Short-Term Bond ETF WORLD BOND BWX SPDR Barclays Capital Intl Treasury Bond WORLD BOND BWZ SPDR Barclays Cap S/T Intl Treasury Bond WORLD BOND WIP SPDR DB Intl Govt Infl-Protected Bond DIVERSIFIED EMERGING MKTS BIK SPDR S&P BRIC 40 DIVERSIFIED EMERGING MKTS VWO Vanguard Emerging Markets Stock ETF Foreign Large Blend EFA iShares MSCI EAFE Index Foreign Large Value IDV iShares Dow Jones Intl Select Div Idx Foreign Small/Mid Value SCZ iShares MSCI EAFE Small Cap Index Global Real Estate RWO SPDR Dow Jones Global Real Estate REAL ESTATE RWR SPDR Dow Jones REIT This is a good selection of funds which hit the main notes -- good choices in fixed income and the US and choices for international and domestic real estate as well as multiple selections in Foreign and emerging market classes.
The US selections have one in the top ten performance ranking and so US there is room for improvement there.
TKRNameRank5 Yr AR%3yr AR%1yr AR%MPIQ ScoreIWOiShares Russell 2000 Growth53.73%5.45%39.77%55.4%VOVanguard Mid-Cap ETF123.60%3.05%36.00%47.8%VOTVanguard Mid-Cap Growth ETF130.00%3.26%42.68%47.6%IWNiShares Russell 2000 Value Index181.61%3.65%32.80%41.5%RSPRydex S&P Equal Weight193.45%3.58%27.38%39.7%IWMiShares Russell 2000 Index202.26%3.50%29.63%39.4%VOEVanguard Mid-Cap Value ETF220.00%2.95%29.26%33.7%DIASPDR DJ Industrial Average274.35%0.33%19.15%28.3%IWFiShares Russell 1000 Growth Index293%2.21%17.76%26.4%SPYSPDR S&P 500302.07%-0.11%21.68%25.7%IWDiShares Russell 1000 Value Index361.14%-2.81%18.67%16.7%MGKVanguard Mega Cap 300 GrowthNRVMGVVanguard Mega Cap 300 ValueNRVVYMVanguard High Dividend Yield IndxNRV
NRV means not ranked because the trading volume was below our cutoff
There is no commodity alternative. This may have been less important in the past, but with inflation almost inevitable, a commodities option such as DBC would make sense.As of Feb 15, 2011, this plan investment choice is rated as average based on MyPlanIQ's plan rating methodology that was designed to measure how effective a plan's available investment funds are .
It has the following detailed ratings:
Diversification -- Rated as great (89%)
Fund Quality -- Rated as below average (17%)
Portfolio Building -- Rated as average (42%)
Overall Rating: average (49%)It is important to note that the fund quality rating is lower because of the lack of history -- as time marches on and the ETFs create more of a trail, we expect that rating to increase.
Portfolio Discussions
The chart and table below show the historical performance of moderate model portfolios employing strategic and tactical asset allocation strategies. For comparison purpose, we also include the moderate model portfolios of a typical 5 asset SIB (Simpler Is Better) plan . This SIB plan has the following candidate index funds and their ETFs equivalent:
US Equity: SPY or VTI
Foreign Equity: EFA or VEU
REITs: IYR or VNQ or ICF
Emerging Market Equity: EEM or VWO
Fixed Income: AGG or BND
Performance chart (as of Feb 15, 2011)Performance table (as of Feb 15, 2011)
Portfolio Name 1Yr AR 1Yr Sharpe 3Yr AR 3Yr Sharpe 5Yr AR 5Yr Sharpe Etrade All Star ETFs Tactical Asset Allocation Moderate 14% 117% 9% 69% 11% 71% Etrade All Star ETFs Strategic Asset Allocation Moderate 16% 146% 2% 12% 5% 19% Five Core Asset ETF Benchmark Tactical Asset Allocation Moderate 14% 124% 8% 65% 11% 72% Five Core Asset ETF Benchmark Strategic Asset Allocation Moderate 19% 157% 4% 18% 6% 24% Currently Real Estate, US Equity and Commodities are doing well. US Equity and Real Estate available to Etrade All Star ETFs participants.
The plan runs neck and neck with the benchmark but we would expect it to pull away as more of the funds establish history and can be used in the portfolio.
To summarize, Etrade All Star ETF plan ticks most of the boxes but would be strengthened by adding commodity choices.
Disclosure:
MyPlanIQ does not have any business relationship with the company or companies mentioned in this article. It does not set up plans. The performance data of portfolios mentioned above are obtained through historical simulation and are hypothetical.
Symbols:SPY,VTI,EFA,VEU,EEM,VWO,IYR,VNQ,ICF,AGG,BND,HYG,JNK,PHB,CIU,BIV,GWL,PFA,IVE,IWW,JKF,VTV,ELV,PWV,RPV,SCHV,SCZ,EFV,PID,DWM,IFGL,RWX,IGOV,BWX,WIP,IVV,IYY,IWV,VV,DLN,RSP,SCHX,SHY,SHV,VGSH,PLK,USY,TLT,TLH,IEF,EDV,VGLT,TLO,PLW,IVW,IWZ,JKE,VUG,ELG,QQQQ,RPG,SCHG,IJJ,IWS,JKI,VOE,EMV,PWP,RFV,UVU,IJH,IWR,JKG,VO,MDY,EMM,PJG,DON,EZM,MVV,IJS,IWN,JKL,VBR,DSV,PWY,RZV,UVT,IJR,IWM,JKJ,VB,DSC,PJM,DES,SAA,UWM,SCHA,GMM,PXH,DEM,SCHE,CLY,LQD,BLV,VCLT,PCY,CSJ,BSV,VCSH,IEI,VGIT,ITE,IJK,IWP,VOT,EMG,PWJ,RFG,UKW,IJT,IWO,JKK,VBK,DSG,PWT,RZG,UKK,TIP,DBC
labels:IRA,Retirement,Investment,ETF,Portfolio,construction,
- End of the Year Review of Luminary Portfolios -- II
01/01/2011
Earlier in the year, we presented a series of reports on lazy portfolios from investing luminaries. We went on to pit them together to come out with an overall winner.
That was then, this is now. It's time to review their progress and look at how they have performed in 2010. This is the second article where we look at the bottom half of the alphabet and see how they have done this year.
We created SIB (Simpler is Better) portfolios one index fund for each asset class (ETF's are ideal for this) as a basic benchmark for each asset class portfolio. A SIB gives you diversification and low cost with no thought to picking a stock or even sub-segment of an asset class.
MyPlanIQ Benchmark
TAA 5 Yr Return Annualized
TAA 1 Year
SAA 1 Year
Asset Classes
15%
8%
10%
6
12%
7%
10%
6
11%
6%
11%
5
9%
8%
11%
4
11%
1%
10%
4
6%
-1%
10%
3
We present four return data points:
- The five year annualized return based on a Tactical Asset Allocation strategy (TAA) -- this gives a viewpoint on the longer term behavior
- The one year TAA return
- The one year Strategic Asset Allocation (SAA) return
We note that for 2010, SAA portfolios have performed better than the SAA but TAA has a better performance metric in the longer run. This will calibrate what we see with the lazy portfolios.
The portfolios are listed by decreasing number of asset classes and decreasing number of funds. We would expect that the portfolio with the greatest number of asset classes to have the highest returns and we will test that to see to what extent it is true.
Table of Lazy Portfolios and their classes and funds
Plan Name
TAA 5 Yr Return Annualized
TAA 1 Year
SAA 1 Year
Original
Asset Classes
11%
6%
11%
7%
5
10%
9%
11%
13%
6
13%
7%
13%
15%
3
6%
10%
14%
9%
3
13%
11%
14%
12%
7
11%
10%
10%
13%
5
9%
9%
13%
11%
4
- Gibson's 5 Equal Asset Allocation Strategy comes from his Asset Allocation: Balancing Financial Risks book. In it, he outlined a simple yet diversified asset allocation model: putting equal amount of investment into 5 asset classes: US Equity, International Equity, REIT, Commodity, Fixed Income.
- Alexander Green proposed this The Gone Fishin' Portfolio. Based on the book the allocation is achieved using Vanguard low cost index funds (in Bogleheads forum, there is a discussion thread devoted to this portfolio)
- Jim Lowell edits MarketWatch's ETF Trader, an investment letter employing a momentum-based exchange-traded-fund strategy for long-term investors. Large and small stocks, proposed his Sower's Growth Portfolio. This is a diversified portfolio of exchange-traded funds
- Bill Schulthe is is a former Smith Barney broker and author of "The Coffeehouse Investor"
- Craig L. Israelsen is an Associate Professor at Brigham Young University where he teaches Personal and Family Finance to over 1,200 students each year. The Israelsen Seven Equally Weighted is aimed to protect the portfolio against losses
- David Swensen, the Yale Endowment Manager, proposed a one size fit in all model portfolio for individual investors. The major difference of this portfolio is the emphasis on international equities (including emerging market equities) and real estate
- John Wasik is a professional journalist and author specializing in personal finance, the environment, investing and social issues. John has proposed a Nano plan investment portfolio which employs a handful of index or ETFs to cover virtually the entire world of bond and stock markets
The one year returns of the original portfolio are presented in order of highest to lowest.
How do the returns compare to what we would have expected?
Plan Name
TAA 5 Yr Return Annualized
TAA
1 Year ReturnSAA
1 Year ReturnOriginal 1Year
Asset Classes
13%
7%
13%
15%
3
10%
9%
11%
13%
6
11%
10%
10%
13%
5
13%
11%
14%
12%
7
9%
9%
13%
11%
4
6%
10%
14%
9%
3
11%
6%
11%
7%
5
- The second half of the group performed slightly better as a group than the first half. Lowell's return is the highest of the bunch -- as a three asset class portfolio, that will be an interesting study as to whether this will continue in 2011
- All of the portfolios exhibited the same behavior of the buy and hold approaches beating TAA -- this is an important lesson that TAA, while having significant benefits in a choppy market, may not perform as well as SAA in a good market
- As we end the year on a relatively strong note, there is still a note of caution and concern about the future and we will have to see how well these portfolios perform next year
Takeaways- 2010 has been a good year for lazy portfolios as stocks have continued their recovery albeit with concern for the future
- TAA has real benefits but so does SAA or buy and hold -- this year demonstrates this point
- Index funds continue to show good results against managed funds
- Larger asset class plans have the benefit of stability and good returns
- ETF’s can be used to implement any of these strategies
- We pick the top three -- Lowell, Green and Swensen Brown to move on to the finals
- The Seven-12 portfolio can feel hard done by because if it were in the top half of the draw, it would have made it through to the finals
labels:investment,
Symbols:ACWI,ACWX,ADRE,AGG,BIV,BLV,BND,BSV,BWX,CFT,CIU,CSJ,DBC,DBV,DIA,DVY,EDV,EEM,EFA,EFG,EFV,EMB,ETF,GLD,GOOG,GSG,GXC,HPQ,HYG,ICF,IEF,IEI,IFGL,IGOV,IGR,IJH,IJJ,IJK,IJR,IJS,IJT,IVE,IVV,IVW,IWB,IWC,IWD,IWF,IWM,IWN,
- Samsung's Excellent 401K Plan, Pushes the ETF Benchmark Hard
12/14/2010
- Ford Motor Company 401K Plan: Diversified and High Quality
10/24/2010
- TD Ameritrade Commission Free ETF’s Empowers Both Strategic and Tactical Asset Allocation
10/19/2010
- Lazy Portfolios -- The Playoffs II
10/19/2010
- Lazy Portfolios -- The Playoffs
10/19/2010
- TD Ameritrade Commission Free ETFs Report On 12/07/2010
12/07/2010
Retirement investing is an integral part of American personal finance. With $8.9 trillion parked in over 800 thousand retirement plans such as 401K, millions of Americans will increasingly rely on their 401K accounts to fund their future retirement needs. This article is part of a series of case studies we are conducting for various 401K plans. In this article, we will discuss how participants in TD Ameritrade Commission Free ETFs can achieve reasonable investment results using asset allocation strategies. We will also discuss how those portfolios are positioned in today’s market environment.
TD Ameritrade (Ticker: AMTD) offers 100+ commission free ETFs for its clients. The main restriction is that customers have to hold these ETFs for more than 30 days to make such trades eligible for commission free.
In this plan, the minimum holding period for each fund is set to be 1 month, which is equivalent to 30 days.
See the official TD Ameritrade offering for more details.
TD Ameritrade Commission Free ETFs's 401K plan consists of 101 funds. These funds enable participants to gain exposure to 6 major assets: US Equity , Foreign Equity , Commodity , Emerging Market Equity , REITs , Fixed Income . The list of minor asset classes covered:
Commodities Broad Basket: GSG , DBC
Conservative Allocation: AOK
Diversified Emerging Mkts: EEM , GMM , PXH , DEM , SCHE
Emerging Markets Bond: PCY
Equity: VTI , VT
Europe Stock: IEV , VGK , PEF , DEB
Foreign Large Blend: EFA , VEU , GWL , PFA
Foreign Large Growth: EFG
Foreign Large Value: EFV , PID , DWM
Foreign Small/mid Growth: IFSM , VSS , SCHC
Foreign Small/mid Value: SCZ
Global Real Estate: IFGL , RWX
High Yield Bond: HYG , JNK , PHB
Inflation-protected Bond: TIP
Intermediate Government: IEI , VGIT , ITE
Intermediate-term Bond: AGG , CIU , BIV , BND
Japan Stock: EWJ , JPP , PJO , DXJ
Large Blend: IVV , IYY , IWV , VTI , VV , SPY , DLN , RSP , SCHX
Large Growth: IVW , IWZ , JKE , VUG , ELG , QQQQ , RPG , SCHG
Large Value: IVE , IWW , JKF , VTV , ELV , PWV , RPV , SCHV
Latin America Stock: ILF , GML
Long Government: TLT , TLH , IEF , EDV , VGLT , TLO , PLW
Long-term Bond: CLY , LQD , BLV , VCLT
Mid-cap Blend: IJH , IWR , JKG , VO , MDY , EMM , PJG , DON , EZM , MVV
Mid-cap Growth: IJK , IWP , VOT , EMG , PWJ , RFG , UKW
Mid-cap Value: IJJ , IWS , JKI , VOE , EMV , PWP , RFV , UVU
Moderate Allocation: AOM
Multisector Bond: AGG , GBF , BND , LAG
Muni National Interm: ITM
Muni National Long: MUB , TFI , PZA , MLN
Muni National Short: SUB , SHM , PVI , SMB
Pacific/asia Ex-japan Stk: EPP , AAXJ , GMF , PAF , DND
Real Estate: IYR , ICF , VNQ
Short Government: SHY , SHV , VGSH , PLK , USY
Short-term Bond: CSJ , BSV , VCSH
Small Blend: IJR , IWM , JKJ , VB , DSC , PJM , DES , SAA , UWM , SCHA
Small Growth: IJT , IWO , JKK , VBK , DSG , PWT , RZG , UKK
Small Value: IJS , IWN , JKL , VBR , DSV , PWY , RZV , UVT
Specialty-real Estate: RWR , PSR , URE
World Allocation: AOR , AOA
World Bond: IGOV , BWX , WIP
World Stock: IOO , VT
As of Dec 3, 2010, this plan investment choice is rated as above average based on MyPlanIQ Plan Rating methodology that was designed to measure how effective a plan's available investment funds are . It has the following detailed ratings:
Diversification -- Rated as great (97%)
Fund Quality -- Rated as below average (21%)
Portfolio Building -- Rated as great (87%)
Overall Rating: above average (70%)The chart and table below show the historical performance of moderate model portfolios employing strategic and tactical asset allocation strategies ( SAA and TAA , both provided by MyPlanIQ). For comparison purpose, we also include the moderate model portfolios of a typical 6 asset SIB (Simpler Is Better) plan . This SIB plan has the following candidate index funds and their ETFs equivalent:
US Equity :( SPY or VTI )
Foreign Equity :( EFA or VEU )
Commodity :( DBC )
Emerging Market Equity :( EEM or VWO )
REITs :( IYR or VNQ or ICF )
Fixed Income :( AGG or BND )
Performance chart (as of Dec 3, 2010)Performance table (as of Dec 3, 2010)
Portfolio Name 1Yr AR 1Yr Sharpe 3Yr AR 3Yr Sharpe 5Yr AR 5Yr Sharpe TD Ameritrade Commission Free ETFs Tactical Asset Allocation Moderate 9% 68% 12% 78% 18% 115% TD Ameritrade Commission Free ETFs Strategic Asset Allocation Moderate 8% 71% -1% -8% 7% 36% Six Core Asset ETFs Tactical Asset Allocation Moderate 10% 67% 9% 69% 16% 105% Six Core Asset ETFs Strategic Asset Allocation Moderate 11% 87% 3% 12% 8% 37% Currently, asset classes in US Equity ( SPY , VTI ) and Emerging Market Equity ( EEM , VWO ) are doing relatively well. These asset classes are available to TD Ameritrade Commission Free ETFs participants.
To summarize, TD Ameritrade Commission Free ETFs plan participants can achieve reasonable investment returns by adopting asset allocation strategies that are tailored to their risk profiles. Currently, the tactical asset allocation strategy indicates overweighing on US Equity and Emerging Market Equity funds.
Disclosure:Symbols: , SPY , VTI , EFA , VEU , EEM , VWO , IYR , VNQ , ICF , AGG , BND , DBC , VT , HYG , JNK , PHB , AOM , AOK , CIU , BIV , ITM , SUB , SHM , PVI , SMB , AOR , AOA , MUB , TFI , PZA , MLN , EFG , GWL , PFA , IVE , IWW , JKF , VTV , ELV , PWV , RPV , SCHV , SCZ , EFV , PID , DWM , IFGL , RWX , IGOV , BWX , WIP , RWR , PSR , URE , IVV , IYY , IWV , VV , DLN , RSP , SCHX , IOO , SHY , SHV , VGSH , PLK , USY , TLT , TLH , IEF , EDV , VGLT , TLO , PLW , IEV , VGK , PEF , DEB , IVW , IWZ , JKE , VUG , ELG , QQQQ , RPG , SCHG , IJJ , IWS , JKI , VOE , EMV , PWP , RFV , UVU , IJH , IWR , JKG , VO , MDY , EMM , PJG , DON , EZM , MVV , IFSM , VSS , SCHC , IJS , IWN , JKL , VBR , DSV , PWY , RZV , UVT , IJR , IWM , JKJ , VB , DSC , PJM , DES , SAA , UWM , SCHA , GMM , PXH , DEM , SCHE , CLY , LQD , BLV , VCLT , GBF , LAG , PCY , CSJ , BSV , VCSH , IEI , VGIT , ITE , IJK , IWP , VOT , EMG , PWJ , RFG , UKW , ILF , GML , IJT , IWO , JKK , VBK , DSG , PWT , RZG , UKK , TIP , EPP , AAXJ , GMF , PAF , DND , EWJ , JPP , PJO , DXJ , GSG
- Vanguard-VA-Clone Report On 12/07/2010
12/07/2010