 |
Vanguard ETF: |  |
7.4%* |
|
Diversified Core: | |
8.1%* |
|
Six Core Asset ETFs: | |
7.3%* |
Articles on GOOG
- Technology Companies Outshine Among Large Cap Growth Stocks
07/19/2011
Large technology companies such as those in Nasdaq 100 (QQQ) (COMP) have been doing exceptionally well in the past five years. They out performed large cap growth stocks. The following table shows the performance of large growth stock ETFs:
As of 7/15/2011
07/15/2011
Description Symbol 1 Yr 3 Yr 5 Yr Avg. Volume(K) 1 Yr Sharpe PowerShares QQQ QQQ 27.88% 10.04% 10.54% 52,975 177.47% Vanguard Growth ETF VUG 26.77% 5.52% 5.66% 373 200.76% iShares Russell 1000 Growth Index IWF 27.2% 5.95% 5.56% 2,268 204.37% iShares S&P 500 Growth Index IVW 25.99% 5.69% 4.89% 562 205.62% For information on more ETF performance, please refer to here. For various stock styles (such as large growth, mid cap, small value etc.), please refer to MyPlanIQ's stock style table.
Nasdaq 100 (QQQ) was the front runner in last 1, 3 and 5 year periods. These technology companies sidestepped the last financial crisis with pristine balance sheets and conservative growth plans, having learned a lesson from the technology bubble in 2001-2002. What is more interesting is that large U.S. technology companies have dramtically expanded their global reach and are now considered multi-national companies. In the past decade, they outsourced some of their development to emerging markets, gradually learned and developed local markets and now are in the perfect position to reap what they have sowed in these rapidly developing economies.
For example, Apple (AAPL) just released its latest quarter earnings report that stated its Chinese sales reached $3.8 billion, up almost sixfold from a year earlier. The company plans to open 30 stores in the September period, including in Hong Kong, broadening a retail chain that generated $3.5 billion in sales last quarter.
The following are the top holdings of QQQ, as of 7/18/2011
Name Symbol Weights (%) Apple (AAPL) 13.35% Microsoft (MSFT) 8.66% Oracle (ORCL) 6.16% Google (GOOG) 5.82% Intel (INTC) 4.56% Amazon (AMZN) 3.69% Qualcomm (QCOM) 3.57% Cisco (CSCO) 3.28% Amgen (AMGN) 1.96% Comcast (CMCSA) 1.93% In general, U.S. large growth companies are positioned well for the economic recovery. For a retirement portfolio, proper exposure into these high quality multi-national companies can be beneficial.
Symbols: COMP, QQQQ, AAPL, ORCL, MSFT, GOOG, INTC, CSCO, AMZN, QCOM, AMGN, CMSCA, ETFs
- SmartMoney Magazine Best Idea Portfolio Compared with a Diversified ETF Portfolio
04/13/2011
SmartMoney magazine published its annual best stock ideas in the February issue titled Where to Invest in 2011. We look at a portfolio that consists of the 12 stocks suggested in the article and compare this with an ETF portfolio.
We construct the portfolio "P SmartMoney Magazine Where to Invest 2011 12 Stocks Since 2011" that had equal weights to each of 12 stocks on 12/31/2010. The following is the list of stocks recommended by SmartMoney Magazine and their weightings on 4/8/2011:
Asset Fund in this portfolio Price Percentage Asset1 LOW (Lowe's Companies Inc.) 26.82 6.33% Asset1 TJX (The TJX Companies, Inc.) 50.7 13.33% Asset1 YUM (Yum! Brands Inc.) 49.58 10.98% Asset1 CMCSA (Comcast Corporation) 24.68 6.35% Asset1 RSG (Republic Services) 29.91 7.08% Asset1 PEP (PepsiCo Inc) 65.73 7.36% Asset1 CSCO (Cisco Systems Inc) 17.65 4.57% Asset1 GOOG (Google Inc) 578.16 7.97% Asset1 ORCL (Oracle Corp.) 33.54 12.29% Asset1 UTX (United Technologies) 84.81 8.66% Asset1 MMM (3M Company) 93.22 7.79% Asset1 UPS (United Parcel Serv) 73.25 7.29% We further construct a portfolio P SmartMoney Magazine Where to Invest 2011 12 Stocks that was started on 1/2/2006.
Buying individual stocks and managing a portfolio with a dozen of stocks is not a small feat: one has to constantly monitor stocks in the portfolio and buy/sell them if it is necessary (such as a fundamental event for a company indicates this company is no longer satisfied with the criteria, or a stock becomes too expensive, or just simply because there is a better more compelling stock available, etc.). In fact, various studies have shown that most professional mutual funds can not even beat a stock index.
On the other hand, an investor can choose a simpler and safer portfolio strategy: asset allocation, especially tactical asset allocation strategy by investing in ETFs or mutual funds. In the case of a tactical asset allocation strategy, it dynamically adjusts the weights of assets represented by ETFs. For example, MyPlanIQ's Tactical Asset Allocation (TAA) strategy adjusts exposure to various assets based on price momentum as well as risk parameters (such as volatility and drawdown).
The following is the list of six assets that represent the major markets:
Asset Class Ticker Name LARGE BLEND VTI Vanguard Total Stock Market ETF Foreign Large Blend VEU Vanguard FTSE All-World ex-US ETF DIVERSIFIED EMERGING MKTS VWO Vanguard Emerging Markets Stock ETF REAL ESTATE VNQ Vanguard REIT Index ETF COMMODITIES BROAD BASKET DBC PowerShares DB Commodity Idx Trking Fund Intermediate-Term Bond BND Vanguard Total Bond Market ETF Other than the fixed income fund (BND), all other five assets are considered as risk assets.
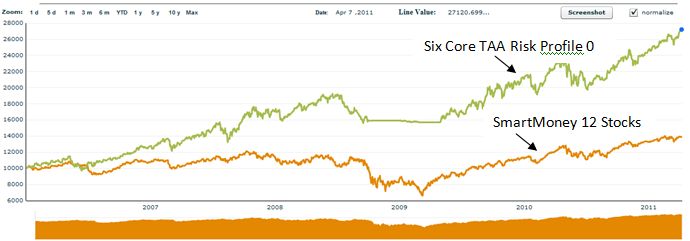
The following compares the performance between P SmartMoney Magazine Where to Invest 2011 12 Stocks and a portfolio with risk profile 0 (i.e. can have 100% invested in the risk assets) Six Core Asset ETF Benchmark TAA Risk Profile 0.
Portfolio Performance Comparison
Portfolio Name 1Yr AR 1Yr Sharpe 3Yr AR 3Yr Sharpe 5Yr AR 5Yr Sharpe P SmartMoney Magazine Where to Invest 2011 12 Stocks 13% 75% 8% 28% 6% 20% Six Core Asset ETF Benchmark TAA Risk Profile 0 19% 91% 16% 81% 20% 95% The following chart illustrates the performance comparison:
We make the following observations:
- The SmartMoney 12 stocks were recommended in Februrary 2011. The portfolio P SmartMoney Magazine Where to Invest 2011 12 Stocks was started on 1/2/2006. It is not exactly a fair comparison: most likely, these stocks were recommended based on their past performance and thus, the portfolio's performance could be more over-estimated.
- It is not exactly fair to compare an U.S. stock portfolio with a diversified portfolio that can invest in foreign stocks, emerging market stocks, REITs and even commodities. One reason behind this is that for most individual investors, they tend to focus on only domestic stocks. We will have a follow up article to compare this portfolio with an U.S. stock ETF portfolio.
- The above illustrates that there are simpler and better way to invest other than picking individual stocks. This is applicable to most average investors. Nevertheless, we acknowledge that few investors do have the possibility to achieve high returns with their systematic method and great insights. It is just for many average investors, they do not have time, means and discipline to do so. This is reflected that majority of professional investors under perform against a stock index such as S&P 500 (SPY).
Symbols: VTI, VEU, VNQ, VWO, DBC, BND, LOW, TJX, YUM, CMCSA, RSG, PEP, CSCO, GOOG, ORCL, UTX, MMM, UPS, EEM
- End of the Year Review of Luminary Portfolios -- II
01/01/2011
Earlier in the year, we presented a series of reports on lazy portfolios from investing luminaries. We went on to pit them together to come out with an overall winner.
That was then, this is now. It's time to review their progress and look at how they have performed in 2010. This is the second article where we look at the bottom half of the alphabet and see how they have done this year.
We created SIB (Simpler is Better) portfolios one index fund for each asset class (ETF's are ideal for this) as a basic benchmark for each asset class portfolio. A SIB gives you diversification and low cost with no thought to picking a stock or even sub-segment of an asset class.
MyPlanIQ Benchmark
TAA 5 Yr Return Annualized
TAA 1 Year
SAA 1 Year
Asset Classes
15%
8%
10%
6
12%
7%
10%
6
11%
6%
11%
5
9%
8%
11%
4
11%
1%
10%
4
6%
-1%
10%
3
We present four return data points:
- The five year annualized return based on a Tactical Asset Allocation strategy (TAA) -- this gives a viewpoint on the longer term behavior
- The one year TAA return
- The one year Strategic Asset Allocation (SAA) return
We note that for 2010, SAA portfolios have performed better than the SAA but TAA has a better performance metric in the longer run. This will calibrate what we see with the lazy portfolios.
The portfolios are listed by decreasing number of asset classes and decreasing number of funds. We would expect that the portfolio with the greatest number of asset classes to have the highest returns and we will test that to see to what extent it is true.
Table of Lazy Portfolios and their classes and funds
Plan Name
TAA 5 Yr Return Annualized
TAA 1 Year
SAA 1 Year
Original
Asset Classes
11%
6%
11%
7%
5
10%
9%
11%
13%
6
13%
7%
13%
15%
3
6%
10%
14%
9%
3
13%
11%
14%
12%
7
11%
10%
10%
13%
5
9%
9%
13%
11%
4
- Gibson's 5 Equal Asset Allocation Strategy comes from his Asset Allocation: Balancing Financial Risks book. In it, he outlined a simple yet diversified asset allocation model: putting equal amount of investment into 5 asset classes: US Equity, International Equity, REIT, Commodity, Fixed Income.
- Alexander Green proposed this The Gone Fishin' Portfolio. Based on the book the allocation is achieved using Vanguard low cost index funds (in Bogleheads forum, there is a discussion thread devoted to this portfolio)
- Jim Lowell edits MarketWatch's ETF Trader, an investment letter employing a momentum-based exchange-traded-fund strategy for long-term investors. Large and small stocks, proposed his Sower's Growth Portfolio. This is a diversified portfolio of exchange-traded funds
- Bill Schulthe is is a former Smith Barney broker and author of "The Coffeehouse Investor"
- Craig L. Israelsen is an Associate Professor at Brigham Young University where he teaches Personal and Family Finance to over 1,200 students each year. The Israelsen Seven Equally Weighted is aimed to protect the portfolio against losses
- David Swensen, the Yale Endowment Manager, proposed a one size fit in all model portfolio for individual investors. The major difference of this portfolio is the emphasis on international equities (including emerging market equities) and real estate
- John Wasik is a professional journalist and author specializing in personal finance, the environment, investing and social issues. John has proposed a Nano plan investment portfolio which employs a handful of index or ETFs to cover virtually the entire world of bond and stock markets
The one year returns of the original portfolio are presented in order of highest to lowest.
How do the returns compare to what we would have expected?
Plan Name
TAA 5 Yr Return Annualized
TAA
1 Year ReturnSAA
1 Year ReturnOriginal 1Year
Asset Classes
13%
7%
13%
15%
3
10%
9%
11%
13%
6
11%
10%
10%
13%
5
13%
11%
14%
12%
7
9%
9%
13%
11%
4
6%
10%
14%
9%
3
11%
6%
11%
7%
5
- The second half of the group performed slightly better as a group than the first half. Lowell's return is the highest of the bunch -- as a three asset class portfolio, that will be an interesting study as to whether this will continue in 2011
- All of the portfolios exhibited the same behavior of the buy and hold approaches beating TAA -- this is an important lesson that TAA, while having significant benefits in a choppy market, may not perform as well as SAA in a good market
- As we end the year on a relatively strong note, there is still a note of caution and concern about the future and we will have to see how well these portfolios perform next year
Takeaways- 2010 has been a good year for lazy portfolios as stocks have continued their recovery albeit with concern for the future
- TAA has real benefits but so does SAA or buy and hold -- this year demonstrates this point
- Index funds continue to show good results against managed funds
- Larger asset class plans have the benefit of stability and good returns
- ETF’s can be used to implement any of these strategies
- We pick the top three -- Lowell, Green and Swensen Brown to move on to the finals
- The Seven-12 portfolio can feel hard done by because if it were in the top half of the draw, it would have made it through to the finals
labels:investment,
Symbols:ACWI,ACWX,ADRE,AGG,BIV,BLV,BND,BSV,BWX,CFT,CIU,CSJ,DBC,DBV,DIA,DVY,EDV,EEM,EFA,EFG,EFV,EMB,ETF,GLD,GOOG,GSG,GXC,HPQ,HYG,ICF,IEF,IEI,IFGL,IGOV,IGR,IJH,IJJ,IJK,IJR,IJS,IJT,IVE,IVV,IVW,IWB,IWC,IWD,IWF,IWM,IWN,
- Lazy Portfolios -- The Playoffs II
10/19/2010
This is the second article as we attempt to whittle down the lazy portfolios to four finalists for great analysis of what makes for a great portfolio. We are in the bottom half of the alphabetical list and the eight are listed in reducing order asset classes and funds. We have stated that the winners should be those with the most asset classes and highest number of funds.
Portfolio Classes Funds ETF Equivalent Seven-12 7 12 Y SIX SIB SAA 6 6 y Gone Fishin' 5 10 y Swensen 6 4 6 Y Wasik`s Nano 4 5 Y Harry Browne 3 4 Y Schultheis 3 3 Y Lowell 2 8 Y We are using this series of comparisons to validate whether this proves to be true.- Craig L. Israelsen, Ph.D., is an Associate Professor at Brigham Young University. The Seven Equally Weighted, twelve fund portfolio is aimed to protect against losses.
- The MyPlanIQ six asset SIB has index funds for each of the asset classes represented and rebalances monthly – this is primarily a benchmark portfolio
- Alexander Green proposed this The Gone Fishin' Portfolio which was outlined in his book 'The Gone Fishin' Portfolio'
- David Swensen, the Yale Endowment Manager, proposed this one size fit in all model portfolio for individual investors.
- John Wasik has been a professional journalist and author for 30 years specializing in personal finance. John proposed a portfolio which employs a handful of index or ETFs
- Harry Browne is the author of Fail-Safe Investing
- Bill Schulthe is is a former Smith Barney broker and author of "The Coffeehouse Investor."
- Jim Lowell edits MarketWatch's ETF Trader, an investment letter employing a momentum-based exchange-traded-fund strategy for long-term investors.
The returns are now presented in order of highest to lowest of the five year returns. How do the returns compare to what we would have expected?
Portfolio/AR(%) 1 Yr 3 Yr 5 Yr Inception Harry Browne 12.49 7.40 8.99 7.31 Six SIB SAA 12.54 1.61 7.44 8.26 Seven-12 15.55 0.80 6.41 6.16 Swensen Six 15.10 (0.24) 6.21 7.10 Gone Fishin' 12.98 (0.34) 5.64 6.72 Wasik`s Nano 15.34 (1.93) 4.74 4.66 Schultheis 9.23 (2.28) 4.68 4.59 Lowell 12.45 (6.26) 3.55 6.74 - The portfolios roughly follow the asset class/fund class as would be expected
- The Harry Browne portfolio stands out as the clear exception to the rule – it has a signnificant lead over the other portfolios
- The six asset SIB performed well – that was expected. Six asset classes with index funds should perform well
When we look at the drawdown for each of the portfolios, it will reveal which is the most painful to own.Portfolio/DD1 Yr3 Yr5 YrInceptionHarry Browne5%15%15%15%Swensen Six8%39%39%39%Six SIB SAA8%39%39%39%Schultheis9%39%39%39%Seven-128%40%40%40%Gone Fishin'9%42%42%42%Wasik`s Nano9%44%44%44%Lowell16%57%57%57%
Again the Harry Browne portfolio is the clear winner.
We select the top two – which are the Harry Browne and Six asset SIB to move to the final round where they will be put against the best two funds from the top half of the alphabet.
Takeaways- The portfolios followed the expected path against asset classes and funds
- The Harry Browne portfolio was the clear winner and was the exception – we will find out in the final article whether it proves the rule
- With the exception of the Harry Browne portfolio, the drawdown ratios are uncomfortably high
- ETF’s can be used to implement any of these strategies
labels:investment,
Symbols:ACWI,ACWX,ADRE,AGG,BIV,BLV,BND,BSV,BWX,CFT,CIU,CSJ,DBC,DBV,DIA,DVY,EDV,EEM,EFA,EFG,EFV,EMB,ETF,GLD,GOOG,GSG,GXC,HPQ,HYG,ICF,IEF,IEI,IFGL,IGOV,IGR,IJH,IJJ,IJK,IJR,IJS,IJT,IVE,IVV,IVW,IWB,IWC,IWD,IWF,IWM,IWN,Portfolio-Building,with,ETFs,Closed-End,Funds,Commodity,ETFs,Currency,ETFs,Developed,Market,ETFs,
- Lazy Portfolios -- The Playoffs
10/19/2010
We have compared the performance of fifteen buy and hold portfolios from investing luminaries. Each of the portfolios was measured for performance against SIBs and their relative merits examined. We now move into a playoff round where we will compare the portfolios with each other and see if we can find an eventual winner and look at why they won and what we can learn from this.
When we were testing the portfolios against SIBs, we introduced a tactical asset allocation strategy which usually turned out to have the best performance. For this series of peer comparisons, we are only going to use a buy and hold strategy. When we find the eventual winner, we will then perform a final comparison with tactical asset allocation and see what we conclude.
The portfolios have been sorted alphabetically and we are going to start with the top part of the alphabet. The portfolios will be listed by decreasing number of asset classes and decreasing number of funds. We would expect that the portfolio with the greatest number of asset classes to have the highest returns and we will test that to see to what extent it is true.
Table of Lazy Portfolios and their classes and fundsPortfolio Classes Funds ETF Equivalent Fund Advice 5 11 Y Gibson 5 6 y Five SIB SAA 5 5 Y Aronson 4 11 y Armstrong 4 7 y Four SIB SAA 4 4 Y Burns/Tobias 3 3 Y - Paul Merriman's FundAdvice.com website has indexed porfolios for several fund companies. The basic strategy is the same as with all the other Lazy Portfolios, here with 11 no-load index funds
- Gibson's 5 Equal Asset Allocation Strategy comes from Roger Gibson’s widely read "Asset Allocation: Balancing Financial Risks.”
- The MyPlanIQ five asset SIB has index funds for each of the asset classes represented and rebalances monthly – this is primarily a benchmark portfolio
- Ted Aronson and his AJO Partners manage about $25 billion of institutional assets. Aronson puts his family's taxable money in this well-diversified portfolio of no-load index funds
- Frank Armstrong, author of The Informed Investor, proposed his portfolio for an MSN Money article
- The MyPlanIQ four asset SIB has index funds for each of the asset classes represented and rebalances monthly – this is primarily a benchmark portfolio
- Scott Burns has covered personal finance and investments for nearly 40 years and ranks as one of the most widely read personal finance writers in the country/ Andrew Tobias, a Harvard alum and writer of 12 books including The Only Investment Guide You'll Ever Need.
Table of Lazy Portfolios and their Annual ReturnsPortfolio/AR(%) 1 Yr 3 Yr 5 Yr Inception Five SIB SAA 14.27 1.73 7.67 8.38 Four SIB SAA 10.76 0.17 7.11 7.40 Fund Advice 10.85 0.24 6.06 6.75 Armstrong 11.69 (1.76) 5.15 5.55 Burns/Tobias 0.45 (2.32) 4.54 4.48 Aronson 8.46 (1.10) 3.48 3.59 Gibson 8.63 (4.72) 0.08 3.43 The returns are now presented in order of highest to lowest of the five year returns. How do the returns compare to what we would have expected.- There was a wider spread than expected on the four and five asset class portfolios and the Burns/Tobias three asset class, three fund portfolio performed better than expected
- A five asset class portfolio came out on top – that was expected. The fact that an index based portfolio won out it also not surprising as index funds often outperform funds with active management
- The fact that a four asset portfolio beat a five asset portfolio demonstrates that picking the right funds in an asset class is important and that index funds deliver good results
- For a very simple three asset portfolio, the Burns/Tobias performance came higher in the league table
- The most surprising result is that the Gibson portfolio performed so poorly. When breaking down the long term results of this portfolio, the selection of asset classes has given the portfolio a modest return with a low drawdown index. In the significant market downturn over the past few years, it suffered (as did most buy and hold strategies) badly and has returned to its modest gains whereas other portfolios have had a higher drawdown ratio but a faster recovery
Table of Lazy Portfolios and their Draw Down RatiosPortfolio/DD 1 Yr 3 Yr 5 Yr Inception Aronson 6% 30% 30% 30% Fund Advice 9% 38% 38% 38% Gibson 7% 38% 38% 38% Four SIB SAA 9% 40% 40% 40% Five SIB SAA 8% 41% 41% 41% Scott Burns 9% 41% 41% 41% Armstrong 11% 44% 44% 44% We list the draw down ratios for each of the portfolios and it’s clear that with the recent turbulence, all of them are higher than would be desired.We will select the top two – which are the four and five asset SIBs to move to the final round where they will be put against the best two funds from the bottom half of the alphabet.
Takeaways- Asset classes and number of funds in each class are an indicator of better returns but it’s not the only thing
- Index funds continue to show good results against managed funds
- or those investing in the very long term, looking at the draw down index is important because it will help you live with the fund selection you have made
- ETF’s can be used to implement any of these strategies
labels:investment,
Symbols:ACWI,ACWX,ADRE,AGG,BIV,BLV,BND,BSV,BWX,CFT,CIU,CSJ,DBC,DBV,DIA,DVY,EDV,EEM,EFA,EFG,EFV,EMB,ETF,GLD,GOOG,GSG,GXC,HPQ,HYG,ICF,IEF,IEI,IFGL,IGOV,IGR,IJH,IJJ,IJK,IJR,IJS,IJT,IVE,IVV,IVW,IWB,IWC,IWD,IWF,IWM,IWN,Portfolio-Building,with,ETFs,Closed-End,Funds,Commodity,ETFs,Currency,ETFs,Developed,Market,ETFs,
- Google’s 401K Plan: Another Good Employee Benefit
09/26/2010