 |
Vanguard ETF: |  |
7.4%* |
|
Diversified Core: | |
8.1%* |
|
Six Core Asset ETFs: | |
7.3%* |
Articles on HPQ
- End of the Year Review of Luminary Portfolios -- II
01/01/2011
Earlier in the year, we presented a series of reports on lazy portfolios from investing luminaries. We went on to pit them together to come out with an overall winner.
That was then, this is now. It's time to review their progress and look at how they have performed in 2010. This is the second article where we look at the bottom half of the alphabet and see how they have done this year.
We created SIB (Simpler is Better) portfolios one index fund for each asset class (ETF's are ideal for this) as a basic benchmark for each asset class portfolio. A SIB gives you diversification and low cost with no thought to picking a stock or even sub-segment of an asset class.
MyPlanIQ Benchmark
TAA 5 Yr Return Annualized
TAA 1 Year
SAA 1 Year
Asset Classes
15%
8%
10%
6
12%
7%
10%
6
11%
6%
11%
5
9%
8%
11%
4
11%
1%
10%
4
6%
-1%
10%
3
We present four return data points:
- The five year annualized return based on a Tactical Asset Allocation strategy (TAA) -- this gives a viewpoint on the longer term behavior
- The one year TAA return
- The one year Strategic Asset Allocation (SAA) return
We note that for 2010, SAA portfolios have performed better than the SAA but TAA has a better performance metric in the longer run. This will calibrate what we see with the lazy portfolios.
The portfolios are listed by decreasing number of asset classes and decreasing number of funds. We would expect that the portfolio with the greatest number of asset classes to have the highest returns and we will test that to see to what extent it is true.
Table of Lazy Portfolios and their classes and funds
Plan Name
TAA 5 Yr Return Annualized
TAA 1 Year
SAA 1 Year
Original
Asset Classes
11%
6%
11%
7%
5
10%
9%
11%
13%
6
13%
7%
13%
15%
3
6%
10%
14%
9%
3
13%
11%
14%
12%
7
11%
10%
10%
13%
5
9%
9%
13%
11%
4
- Gibson's 5 Equal Asset Allocation Strategy comes from his Asset Allocation: Balancing Financial Risks book. In it, he outlined a simple yet diversified asset allocation model: putting equal amount of investment into 5 asset classes: US Equity, International Equity, REIT, Commodity, Fixed Income.
- Alexander Green proposed this The Gone Fishin' Portfolio. Based on the book the allocation is achieved using Vanguard low cost index funds (in Bogleheads forum, there is a discussion thread devoted to this portfolio)
- Jim Lowell edits MarketWatch's ETF Trader, an investment letter employing a momentum-based exchange-traded-fund strategy for long-term investors. Large and small stocks, proposed his Sower's Growth Portfolio. This is a diversified portfolio of exchange-traded funds
- Bill Schulthe is is a former Smith Barney broker and author of "The Coffeehouse Investor"
- Craig L. Israelsen is an Associate Professor at Brigham Young University where he teaches Personal and Family Finance to over 1,200 students each year. The Israelsen Seven Equally Weighted is aimed to protect the portfolio against losses
- David Swensen, the Yale Endowment Manager, proposed a one size fit in all model portfolio for individual investors. The major difference of this portfolio is the emphasis on international equities (including emerging market equities) and real estate
- John Wasik is a professional journalist and author specializing in personal finance, the environment, investing and social issues. John has proposed a Nano plan investment portfolio which employs a handful of index or ETFs to cover virtually the entire world of bond and stock markets
The one year returns of the original portfolio are presented in order of highest to lowest.
How do the returns compare to what we would have expected?
Plan Name
TAA 5 Yr Return Annualized
TAA
1 Year ReturnSAA
1 Year ReturnOriginal 1Year
Asset Classes
13%
7%
13%
15%
3
10%
9%
11%
13%
6
11%
10%
10%
13%
5
13%
11%
14%
12%
7
9%
9%
13%
11%
4
6%
10%
14%
9%
3
11%
6%
11%
7%
5
- The second half of the group performed slightly better as a group than the first half. Lowell's return is the highest of the bunch -- as a three asset class portfolio, that will be an interesting study as to whether this will continue in 2011
- All of the portfolios exhibited the same behavior of the buy and hold approaches beating TAA -- this is an important lesson that TAA, while having significant benefits in a choppy market, may not perform as well as SAA in a good market
- As we end the year on a relatively strong note, there is still a note of caution and concern about the future and we will have to see how well these portfolios perform next year
Takeaways- 2010 has been a good year for lazy portfolios as stocks have continued their recovery albeit with concern for the future
- TAA has real benefits but so does SAA or buy and hold -- this year demonstrates this point
- Index funds continue to show good results against managed funds
- Larger asset class plans have the benefit of stability and good returns
- ETF’s can be used to implement any of these strategies
- We pick the top three -- Lowell, Green and Swensen Brown to move on to the finals
- The Seven-12 portfolio can feel hard done by because if it were in the top half of the draw, it would have made it through to the finals
labels:investment,
Symbols:ACWI,ACWX,ADRE,AGG,BIV,BLV,BND,BSV,BWX,CFT,CIU,CSJ,DBC,DBV,DIA,DVY,EDV,EEM,EFA,EFG,EFV,EMB,ETF,GLD,GOOG,GSG,GXC,HPQ,HYG,ICF,IEF,IEI,IFGL,IGOV,IGR,IJH,IJJ,IJK,IJR,IJS,IJT,IVE,IVV,IVW,IWB,IWC,IWD,IWF,IWM,IWN,
- Lazy Portfolios -- The Playoffs II
10/19/2010
This is the second article as we attempt to whittle down the lazy portfolios to four finalists for great analysis of what makes for a great portfolio. We are in the bottom half of the alphabetical list and the eight are listed in reducing order asset classes and funds. We have stated that the winners should be those with the most asset classes and highest number of funds.
Portfolio Classes Funds ETF Equivalent Seven-12 7 12 Y SIX SIB SAA 6 6 y Gone Fishin' 5 10 y Swensen 6 4 6 Y Wasik`s Nano 4 5 Y Harry Browne 3 4 Y Schultheis 3 3 Y Lowell 2 8 Y We are using this series of comparisons to validate whether this proves to be true.- Craig L. Israelsen, Ph.D., is an Associate Professor at Brigham Young University. The Seven Equally Weighted, twelve fund portfolio is aimed to protect against losses.
- The MyPlanIQ six asset SIB has index funds for each of the asset classes represented and rebalances monthly – this is primarily a benchmark portfolio
- Alexander Green proposed this The Gone Fishin' Portfolio which was outlined in his book 'The Gone Fishin' Portfolio'
- David Swensen, the Yale Endowment Manager, proposed this one size fit in all model portfolio for individual investors.
- John Wasik has been a professional journalist and author for 30 years specializing in personal finance. John proposed a portfolio which employs a handful of index or ETFs
- Harry Browne is the author of Fail-Safe Investing
- Bill Schulthe is is a former Smith Barney broker and author of "The Coffeehouse Investor."
- Jim Lowell edits MarketWatch's ETF Trader, an investment letter employing a momentum-based exchange-traded-fund strategy for long-term investors.
The returns are now presented in order of highest to lowest of the five year returns. How do the returns compare to what we would have expected?
Portfolio/AR(%) 1 Yr 3 Yr 5 Yr Inception Harry Browne 12.49 7.40 8.99 7.31 Six SIB SAA 12.54 1.61 7.44 8.26 Seven-12 15.55 0.80 6.41 6.16 Swensen Six 15.10 (0.24) 6.21 7.10 Gone Fishin' 12.98 (0.34) 5.64 6.72 Wasik`s Nano 15.34 (1.93) 4.74 4.66 Schultheis 9.23 (2.28) 4.68 4.59 Lowell 12.45 (6.26) 3.55 6.74 - The portfolios roughly follow the asset class/fund class as would be expected
- The Harry Browne portfolio stands out as the clear exception to the rule – it has a signnificant lead over the other portfolios
- The six asset SIB performed well – that was expected. Six asset classes with index funds should perform well
When we look at the drawdown for each of the portfolios, it will reveal which is the most painful to own.Portfolio/DD1 Yr3 Yr5 YrInceptionHarry Browne5%15%15%15%Swensen Six8%39%39%39%Six SIB SAA8%39%39%39%Schultheis9%39%39%39%Seven-128%40%40%40%Gone Fishin'9%42%42%42%Wasik`s Nano9%44%44%44%Lowell16%57%57%57%
Again the Harry Browne portfolio is the clear winner.
We select the top two – which are the Harry Browne and Six asset SIB to move to the final round where they will be put against the best two funds from the top half of the alphabet.
Takeaways- The portfolios followed the expected path against asset classes and funds
- The Harry Browne portfolio was the clear winner and was the exception – we will find out in the final article whether it proves the rule
- With the exception of the Harry Browne portfolio, the drawdown ratios are uncomfortably high
- ETF’s can be used to implement any of these strategies
labels:investment,
Symbols:ACWI,ACWX,ADRE,AGG,BIV,BLV,BND,BSV,BWX,CFT,CIU,CSJ,DBC,DBV,DIA,DVY,EDV,EEM,EFA,EFG,EFV,EMB,ETF,GLD,GOOG,GSG,GXC,HPQ,HYG,ICF,IEF,IEI,IFGL,IGOV,IGR,IJH,IJJ,IJK,IJR,IJS,IJT,IVE,IVV,IVW,IWB,IWC,IWD,IWF,IWM,IWN,Portfolio-Building,with,ETFs,Closed-End,Funds,Commodity,ETFs,Currency,ETFs,Developed,Market,ETFs,
- Lazy Portfolios -- The Playoffs
10/19/2010
We have compared the performance of fifteen buy and hold portfolios from investing luminaries. Each of the portfolios was measured for performance against SIBs and their relative merits examined. We now move into a playoff round where we will compare the portfolios with each other and see if we can find an eventual winner and look at why they won and what we can learn from this.
When we were testing the portfolios against SIBs, we introduced a tactical asset allocation strategy which usually turned out to have the best performance. For this series of peer comparisons, we are only going to use a buy and hold strategy. When we find the eventual winner, we will then perform a final comparison with tactical asset allocation and see what we conclude.
The portfolios have been sorted alphabetically and we are going to start with the top part of the alphabet. The portfolios will be listed by decreasing number of asset classes and decreasing number of funds. We would expect that the portfolio with the greatest number of asset classes to have the highest returns and we will test that to see to what extent it is true.
Table of Lazy Portfolios and their classes and fundsPortfolio Classes Funds ETF Equivalent Fund Advice 5 11 Y Gibson 5 6 y Five SIB SAA 5 5 Y Aronson 4 11 y Armstrong 4 7 y Four SIB SAA 4 4 Y Burns/Tobias 3 3 Y - Paul Merriman's FundAdvice.com website has indexed porfolios for several fund companies. The basic strategy is the same as with all the other Lazy Portfolios, here with 11 no-load index funds
- Gibson's 5 Equal Asset Allocation Strategy comes from Roger Gibson’s widely read "Asset Allocation: Balancing Financial Risks.”
- The MyPlanIQ five asset SIB has index funds for each of the asset classes represented and rebalances monthly – this is primarily a benchmark portfolio
- Ted Aronson and his AJO Partners manage about $25 billion of institutional assets. Aronson puts his family's taxable money in this well-diversified portfolio of no-load index funds
- Frank Armstrong, author of The Informed Investor, proposed his portfolio for an MSN Money article
- The MyPlanIQ four asset SIB has index funds for each of the asset classes represented and rebalances monthly – this is primarily a benchmark portfolio
- Scott Burns has covered personal finance and investments for nearly 40 years and ranks as one of the most widely read personal finance writers in the country/ Andrew Tobias, a Harvard alum and writer of 12 books including The Only Investment Guide You'll Ever Need.
Table of Lazy Portfolios and their Annual ReturnsPortfolio/AR(%) 1 Yr 3 Yr 5 Yr Inception Five SIB SAA 14.27 1.73 7.67 8.38 Four SIB SAA 10.76 0.17 7.11 7.40 Fund Advice 10.85 0.24 6.06 6.75 Armstrong 11.69 (1.76) 5.15 5.55 Burns/Tobias 0.45 (2.32) 4.54 4.48 Aronson 8.46 (1.10) 3.48 3.59 Gibson 8.63 (4.72) 0.08 3.43 The returns are now presented in order of highest to lowest of the five year returns. How do the returns compare to what we would have expected.- There was a wider spread than expected on the four and five asset class portfolios and the Burns/Tobias three asset class, three fund portfolio performed better than expected
- A five asset class portfolio came out on top – that was expected. The fact that an index based portfolio won out it also not surprising as index funds often outperform funds with active management
- The fact that a four asset portfolio beat a five asset portfolio demonstrates that picking the right funds in an asset class is important and that index funds deliver good results
- For a very simple three asset portfolio, the Burns/Tobias performance came higher in the league table
- The most surprising result is that the Gibson portfolio performed so poorly. When breaking down the long term results of this portfolio, the selection of asset classes has given the portfolio a modest return with a low drawdown index. In the significant market downturn over the past few years, it suffered (as did most buy and hold strategies) badly and has returned to its modest gains whereas other portfolios have had a higher drawdown ratio but a faster recovery
Table of Lazy Portfolios and their Draw Down RatiosPortfolio/DD 1 Yr 3 Yr 5 Yr Inception Aronson 6% 30% 30% 30% Fund Advice 9% 38% 38% 38% Gibson 7% 38% 38% 38% Four SIB SAA 9% 40% 40% 40% Five SIB SAA 8% 41% 41% 41% Scott Burns 9% 41% 41% 41% Armstrong 11% 44% 44% 44% We list the draw down ratios for each of the portfolios and it’s clear that with the recent turbulence, all of them are higher than would be desired.We will select the top two – which are the four and five asset SIBs to move to the final round where they will be put against the best two funds from the bottom half of the alphabet.
Takeaways- Asset classes and number of funds in each class are an indicator of better returns but it’s not the only thing
- Index funds continue to show good results against managed funds
- or those investing in the very long term, looking at the draw down index is important because it will help you live with the fund selection you have made
- ETF’s can be used to implement any of these strategies
labels:investment,
Symbols:ACWI,ACWX,ADRE,AGG,BIV,BLV,BND,BSV,BWX,CFT,CIU,CSJ,DBC,DBV,DIA,DVY,EDV,EEM,EFA,EFG,EFV,EMB,ETF,GLD,GOOG,GSG,GXC,HPQ,HYG,ICF,IEF,IEI,IFGL,IGOV,IGR,IJH,IJJ,IJK,IJR,IJS,IJT,IVE,IVV,IVW,IWB,IWC,IWD,IWF,IWM,IWN,Portfolio-Building,with,ETFs,Closed-End,Funds,Commodity,ETFs,Currency,ETFs,Developed,Market,ETFs,
- Case Study: Hewlett Packard's 401K Plan
10/09/2010
Retirement investing is an integral part of American personal finance. With $8.9 trillion parked in over 800 thousand retirement plans [401K], millions of Americans will increasingly rely on their 401K accounts to fund their future retirement needs. This article is part of a series of case studies we are conducting for various 401K plans. In this article, we will discuss how participants in Hewlett Packard's 401K plan can achieve reasonable investment results using asset allocation strategies. We will also discuss how those portfolios are positioned in today’s market environment.
Hewlett Packard (HP) (NYSE: HPQ) is one of the largest IT companies. Founded by Bill Hewlett and Dave Packard in Palo Alto, California, HP was the earliest technology company that eventually led to the formation of Silicon Valley. Today Hewlett-Packard has over 300 thousands employees world wide.
HP is known to be employee friendly. It has been named several times as one of the best companies to work for. Its 401k plan provides a well diversified array of high quality funds.
Hewlett Packard's 401K plan consists of 29 funds. These funds enable participants to gain exposure to 5 major assets: US Equity, Foreign Equity, Emerging Market Equity, REITs and Fixed Income. The the list of minor asset classes covered:
Large Blend: SPY, VTI
Large Value: IWD, VTV
Large Growth: IWF, VUG
Mid-Cap Blend: MDY, IWR
Foreign Large Blend: EFA
Foreign Large Growth: EFG
Foreign Large Value: EFV
Foreign Small/Mid Growth: SCZ
Diversified Emerging Mkts: EEM, VWO
Real Estate: IYR, ICF, VNQ
World Bond: BWX
Emerging Markets Bond: PCY, EMB
Inflation-Protected Bond: TIP
Intermediate-Term Bond: AGG, BND
Long Government: IEF, TLT
UltraShort Bond: BSV
Muni National Long: MUB
High Yield Bond: HYG, JNKAs of 9/13/2010, this plan investment choice is rated as Above Average based on MyPlanIQ Plan Rating methodology that was designed to measure how effective a plan's available investment funds are. It has the following detailed ratings:
Diversification – Rated as great (score: 89%)
Fund Quality – Rated as above average (score: 76%)
Portfolio Building -- Rated as above average (score: 72%)
Overall Rating: above average (score: 78%)
The chart and table below show the historical performance of moderate model portfolios employing strategic and tactical asset allocation strategies (SAA and TAA, both provided by MyPlanIQ). For comparison purpose, we also include the moderate model portfolios of a typical five asset SIB (Simpler Is Better) plan. This SIB plan has the following candidate index funds and their ETFs equivalent:
US Equity (SPY or VTI)
Foreign Equity (EFA or VEU)
Emerging Market Equity (EEM or VWO)
REITs (IYR or VNQ or ICF)
Fixed Income (AGG or BND)
Performance chart (as of 9/13/2010)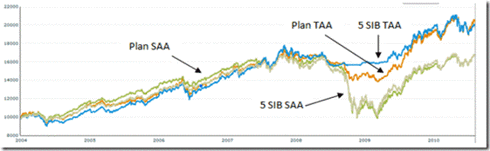
Performance table (as of 9/13/2010)
1 Yr AR (%) 1 Yr Sharpe (%) 3 Yr AR (%) 3 Yr Sharpe(%) 5 Yr AR (%) 5 YR Sharpe (%) Plan SAA 15.95 145.83 2.34 10.27 5.76 29.43 5 SIB SAA 13.09 96.52 2.49 8.77 6.74 29.02 Plan TAA 15.53 103.28 9.35 73.75 11.43 88.56 5 SIB TAA 9.99 68.82 8.11 66.77 11.62 92.08 Currently, asset classes in emerging market stocks (EEM, VWO), REITs (Real Estate Investment Trusts) (VNQ, IYR, ICF) and fixed income (AGG, BND) are doing relatively well. These asset classes are available to HP 401k participants.
To summarize, Hewlett Packard 401K plan participants can achieve reasonable investment returns by adopting asset allocation strategies that are tailored to their risk profiles. Currently, the tactical asset allocation strategy indicates overweighing on emerging market stocks, REITs and fixed income funds.
labels:investment,
Symbols:BND,BSV,BWX,EFA,EFG,EFV,EMB,HPQ,HYG,ICF,IEF,IWD,IWF,IWR,IYR,JNK,MDY,MUB,PCY,PHB,SCZ,SPY,TLT,VEU,VNQ,VTI,VTV,VUG,Fixed,Income,Asset,Allocation,Bonds,Dollar/Currencies,Earnings,
- Google’s 401K Plan: Another Good Employee Benefit
09/26/2010
In our previous article, we discussed Hewlett Packard 401K plan. This article continues the series of case studies for various 401K plans for IT companies. It discusses Google 401K Plan and how portfolios in this plan are positioned in today’s market environment.
Google (NASDAQ: GOOG) is an internet search and advertising company that pioneered in search technology. It dominates search and its related advertising business. It is headquartered in the old SGI building in Mountain View, California. Google is well known for its talented employees and innovation friendly work environment. Google offers generous 401K match to its employees.
Google 401K plan consists of 15 funds. These funds enable participants to gain exposure to 4 major assets: US Equity, Foreign Equity, REITs and Fixed Income. The list of minor asset classes covered are
Large Blend: SPY, VTI
Mid-Cap Blend: MDY, IWR
Foreign Large Blend: EFA
Foreign Large Growth: EFG
Real Estate: IYR, ICF, VNQ
Intermediate-Term Bond: AGG, BND
Short Bond: BSVAs of 9/15/2010, this plan investment choice is rated as Above Average based on MyPlanIQ Plan Rating methodology that was designed to measure how effective a plan's available investment funds are. It has the following detailed ratings:
Diversification – Rated as average (score: 62%)
Fund Quality – Rated as above average (score: 65%)
Portfolio Building -- Rated as great (score: 92%)
Overall Rating: above average (score: 75%)
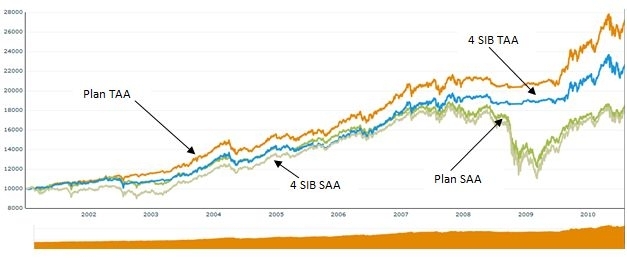
The chart and table below show the historical performance of moderate model portfolios employing strategic and tactical asset allocation strategies (SAA and TAA, both provided by MyPlanIQ). For comparison purpose, we also include the moderate model portfolios of a typical four asset SIB (Simpler Is Better) plan. This SIB plan has the following candidate index funds and their ETFs equivalent:
US Equity (SPY or VTI)
Foreign Equity (EFA or VEU)
REITs (IYR or VNQ or ICF)
Fixed Income (AGG or BND)
Performance chart (as of 9/15/2010)
Performance table (as of 9/15/2010)
1 Yr AR (%) 1 Yr Sharpe (%) 3 Yr AR (%) 3 Yr Sharpe(%) 5 Yr AR (%) 5 YR Sharpe (%) Plan SAA 9 83 1 4 4 18 4 SIB SAA 10 72 1 3 5 17 Plan TAA 14 93 11 97 11 101 4 SIB TAA 9 59 7 61 9 80 Currently, asset classes in REITs (Real Estate Investment Trusts) (VNQ, IYR, ICF) and fixed income (AGG, BND) are doing relatively well. These asset classes are available to Google 401k plan participants.
To summarize, Google 401K plan participants can achieve reasonable investment returns by adopting asset allocation strategies that are tailored to their risk profiles. Currently, the tactical asset allocation strategy indicates overweighing on REITs and fixed income funds.
labels:investment,
Symbols:GOOG,HPQ,SPY,VTI,IWD,VTV,IWF,VUG,MDY,IWR,EFA,EFG,EFV,SCZ,IYR,ICF,VNQ,BWX,PCY,EMB,BND,IEF,TLT,BSV,MUB,HYG,JNK,PHB,VEU,ETF,Portfolio,Building,Asset,Allocation,IRA,401K,
- Getting Most out of Your Retirement Plan: A Case Study on Hewlett Packard 401K Plan
09/16/2010

- Hewlett Packard 401K Report On 06/13/2011
06/13/2011
Retirement investing is a long term process. This report reviews Hewlett Packard 401K plan. We will discuss the investment choices and present the plan rating by MyPlanIQ. Current economic and market conditions are discussed in the context of the investment portfolios in the plan. We will then show how investors in Hewlett Packard 401K can achieve reasonable investment results using asset allocation strategies.
Plan Review and Rating
Hewlett Packard (Ticker:HPQ) has the "Hewlett Packard 401K".
Hewlett Packard Company (commonly known as 'HP') (NYSE: HPQ) is one of the largest IT companies. Founded by Bill Hwelett and Dave Packard in Palo Alto, California, HP was the earliest technology company that eventually led the formation of Silicon Valley in the San Francisco bay area. Today Hewlett-Packard has over 300 thousands employees world wide.
HP is renown to be employee friendly. It has been named several times as one of the best companies to work for. Its 401k plan provides a fairly diversified array of high quality funds.
Hewlett Packard 401K's 401K plan consists of 29 funds. These funds enable participants to gain exposure to 5 major assets: US Equity, Foreign Equity, Emerging Market Equity, REITs, Fixed Income.
As of Jun 13, 2011, this plan investment choice is rated as above average based on MyPlanIQ Plan Rating methodology that measures the effectiveness of a plan's available investment funds. It has the following detailed ratings:
Diversification -- Rated as great (97%)
Fund Quality -- Rated as average (62%)
Portfolio Building -- Rated as above average (65%)
Overall Rating: above average (74%)Current Economic and Market Conditions
Last week marked the sixth week of losses in the U.S. stock market. Investors are now clearly in a risk off mode. Key observations include
- U.S. stock market index (Vanguard Total Stock Market Index (VTI)), for example, is now ranked below U.S. 7-10 long term treasury bonds (IEF) and just a notch above credit bond index (CFT) in our major trend table.
- For the time being, commodities (DBC) and Gold (GLD) are still holding first places, with international REITs (RWX) is still strong.
- On the fixed income side, long bonds (TLT) (LQD) are now trending higher while emerging market bonds (PCY) is still holding a higher place.
This shows investors' strong risk aversion but it is still not water shed flight to safety moment yet. Again, we are vigilant to monitor how markets are unfolding here.
For more information on how these assets are ranked, please see here.
Assets Class Symbols 05/27
Trend
Score05/20
Trend
ScoreDirection International REITs RWX 11.77% 10.82% ^ Commodities DBC 10.84% 10.32% ^ US Equity REITs VNQ 10.77% 10.41% ^ Gold GLD 9.42% 10.06% v Emerging Market Stks VWO 8.56% 6.72% ^ US Stocks VTI 8.29% 8.23% ^ International Developed Stks EFA 6.77% 5.23% ^ US High Yield Bonds JNK 6.37% 6.37% v International Treasury Bonds BWX 5.96% 4.66% ^ Frontier Market Stks FRN 4.05% 4.27% v Emerging Mkt Bonds PCY 3.57% 4.27% v Intermediate Treasuries IEF 2.71% 2.39% ^ US Credit Bonds CFT 2.5% 2.81% v Municipal Bonds MUB 2.13% 2.0% ^ Total US Bonds BND 1.99% 1.92% ^ Mortgage Back Bonds MBB 1.75% 1.8% v Treasury Bills SHV 0.07% 0.02% ^ Portfolio Discussions
The chart and table below show the historical performance of moderate model portfolios employing strategic and tactical asset allocation strategies. For comparison purpose, we also include the moderate model portfolios of a typical 5 asset SIB (Simpler Is Better) plan . This SIB plan has the following candidate index funds and their ETFs equivalent:
US Equity: SPY or VTI
Foreign Equity: EFA or VEU
Emerging Market Equity: EEM or VWO
REITs: IYR or VNQ or ICF
Fixed Income: AGG or BND
Performance chart (as of Jun 13, 2011)Performance table (as of Jun 13, 2011)
Portfolio Name 1Yr AR 1Yr Sharpe 3Yr AR 3Yr Sharpe 5Yr AR 5Yr Sharpe Hewlett Packard 401K Tactical Asset Allocation Moderate 9% 94% 11% 87% 12% 93% Hewlett Packard 401K Strategic Asset Allocation Moderate 15% 201% 5% 26% 6% 36% Five Core Asset ETF Benchmark Tactical Asset Allocation Moderate 10% 102% 9% 74% 11% 77% Five Core Asset ETF Benchmark Strategic Asset Allocation Moderate 16% 154% 4% 17% 7% 27% Currently are doing well. But these asset classes are not available to Hewlett Packard 401K participants.
To summarize, investors adopting Hewlett Packard 401K plan can achieve reasonable investment returns by adopting asset allocation strategies that are tailored to their risk profiles.
Symbols:HPQ, CASH, SPY, VTI, VEU, VWO, VNQ, BND, ICAEX, ARTIX, PHIYX, LZEMX, PRRIX, VPMCX, RNWFX, PIGLX, MIDJX, DODFX, DSFRX, FMAGX, FCNTX, FRESX, FLPSX, DODGX, PTRIX, PEBIX, PISIX, PIGIX, PFMIX, PTSHX, PFGCX, VEXMX, CRIMX
Exchange Tickers: (HPQ), (CASH), (SPY), (VTI), (VEU), (VWO), (VNQ), (BND), (ICAEX), (ARTIX), (PHIYX), (LZEMX), (PRRIX), (VPMCX), (RNWFX), (PIGLX), (MIDJX), (DODFX), (DSFRX), (FMAGX), (FCNTX), (FRESX), (FLPSX), (DODGX), (PTRIX), (PEBIX), (PISIX), (PIGIX), (PFMIX), (PTSHX), (PFGCX), (VEXMX), (CRIMX) - Hewlett Packard 401K Report On 06232011
06/23/2011