MyPlanIQ offers both a Tactical Asset Allocation Strategy (TAA) and a Strategic Asset Allocation Strategy (SAA). TAA can dynamically change a portfolio’s allocation among stocks and bonds, while SAA usually keeps an allocation for a long time, changed only occasionally if we decide that certain secular trends warrant a change (hence, strategic).
MyPlanIQ Tactical Asset Allocation (TAA) Strategy
Principles
The TAA strategy is based on a long-held observation that major asset classes, such as stocks and bonds, exhibit strong price trends — i.e., the price of a major asset such as U.S. stocks collectively can continue to go up or down once a major uptrend or downtrend is established. Not to be confused with individual stock momentum or short-term timing (such as daily movements), this phenomenon has been discussed and shown to exist for a long time.
Jeremy Siegel’s analysis of the 200-day simple moving average (SMA) as a market timing tool is detailed in his book Stocks for the Long Run. Siegel tested this strategy using data from 1886 to 2006, focusing on the Dow Jones Industrial Average (DJIA). His approach involved buying the DJIA when it closed at least 1% above its 200-day moving average and selling when it closed at least 1% below. This 1% buffer was implemented to reduce the number of trades and minimize the impact of short-term market fluctuations. He found that the strategy could effectively avoid large interim drawdowns while achieving comparable returns as the simple buy and hold DJIA strategy: The timing strategy yielded an annualized return of 9.73%, compared to 9.39% for a buy-and-hold approach. After accounting for transaction costs, the timing strategy’s return decreased to 8.11%. We want to point out that the transaction cost is no longer a major factor these days because of commission free ETF trading and high liquidity.
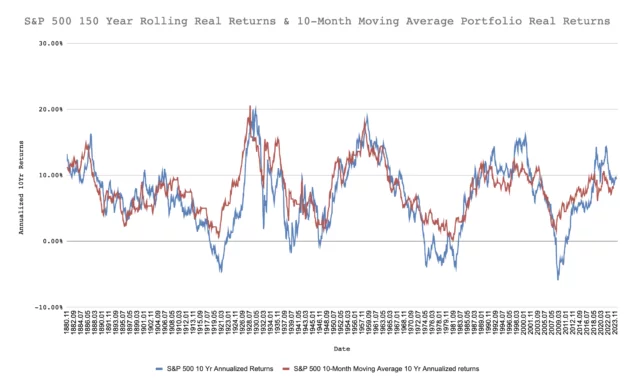
Our independent study on S&P 500 from 1871 to 2015 also confirms the effectiveness of the moving average strategy: The annualized real return from 1871 of the 10-Month moving average based portfolio for the S&P 500 is 7.9%, approximately 1% higher than the S&P 500’s annualized real returns over the same period.
The following shows the 10-year rolling return charts for both the moving average portfolio and the S&P 500:
However, the simple moving average can still misfire too frequently. That’s why we developed our own Composite Asset Allocation Indicator.
MyPlanIQ Composite Asset Allocation Indicator
Our composite signal incorporates economic indicators that are sensitive to a recession. Economists have found that indicators on employment, consumer consumption, industrial output, inflation, and housing activity are all useful in this regard. However, it is also well known that relying on these indicators alone can result in too many false signals.
In addition, we also incorporate financial market indicators such as trends among various major asset classes (such as stocks and bonds) and credit markets.
The result is the MyPlanIQ Composite Asset Allocation Indicator, which has improved the effectiveness of predicting or reacting to early financial market downturns. The indicator is a monthly signal, meaning it changes value only once per month.
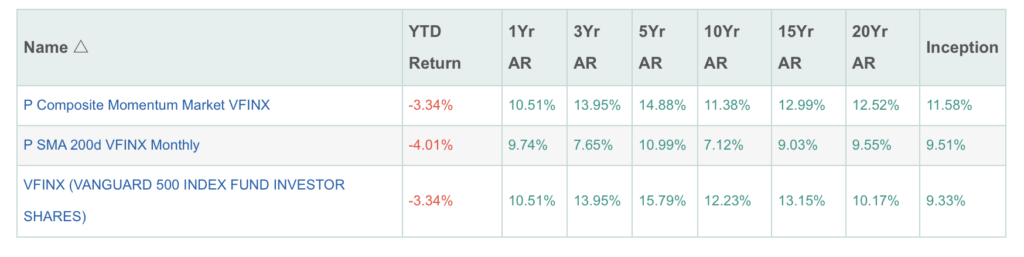
Here are the results showing how our composite indicator has improved upon the standard 200-day moving average strategy applied to the S&P 500 (VFINX – Vanguard 500 Index Fund).
From 1/13/1997 to 5/8/2025:
And the 10-Year Rolling Returns charts clearing show that the Composite Signal Based P Composite Momentum Market VFINX has consistently ourperformed the standard 200-day moving average portfolio and the buy-and-hold VFINX (S&P 500 index fund):
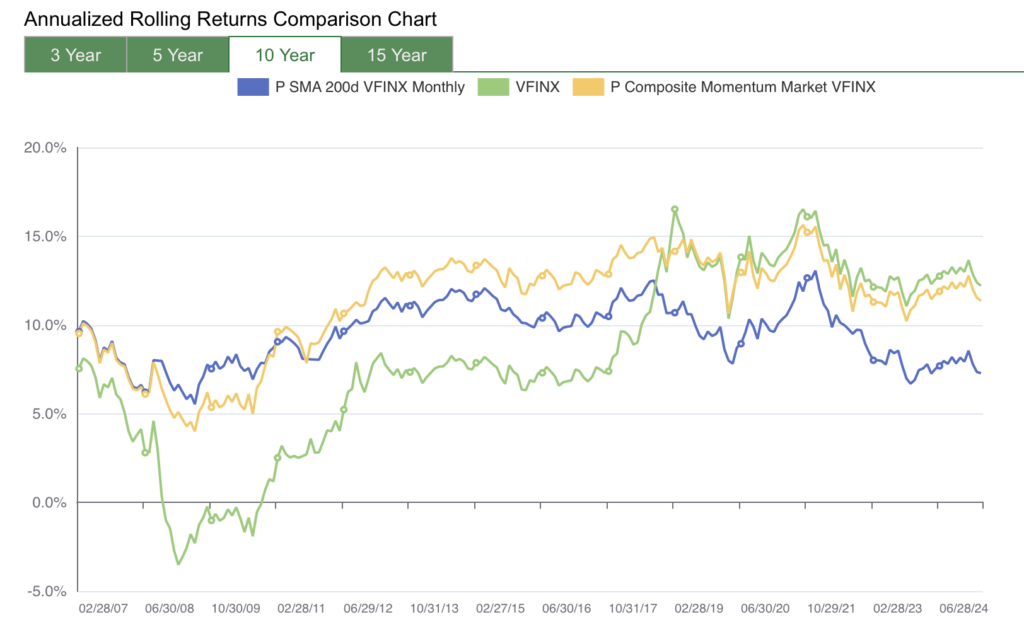
See this link for the up to date comparison.
Relative Momentum
Researchers and practitioners also have uncovered that the price momentum is one of the strong factor among stocks and other even bonds. This has been evident by the popular and effective factor ETFs such as momentum factor ETF like MTUM (iShares MSCI USA Momentum Factor ETF), SPMO (Invesco S&P 500® Momentum ETF), JMOM (JPMorgan U.S. Momentum Factor ETF), or VFMO (Vanguard U.S. Momentum Factor). The ETFs overweight stocks with highest momentum and they have achieved market beating returns.
The relative momentum effect also exists among asset classes such as U.S. large-cap stocks, mid-cap stocks, small-cap stocks, international stocks, bonds, and others.
Furthermore, relative momentum extends to individual funds within an asset class. This allows us to use relative momentum to select the top-performing funds among the candidate funds in a given asset class. It is similar to momentum in individual stocks, but applied one level higher at the fund level.
Composite Indicator + Relative Momentum Among Major Assets
MyPlanIQ was one of the first to combine the composite indicator with relative momentum. The result is the MyPlanIQ Tactical Asset Allocation (TAA) strategy, which not only significantly reduces maximum drawdown but also improves returns.
The following are the live return data among some TAA based portfolios, compared with their benchmark index funds.
Globle stock allocations:
| Name | YTD Return | 1Yr AR | 3Yr AR | 5Yr AR | 10Yr AR | 15Yr AR | 20Yr AR | Inception |
|---|---|---|---|---|---|---|---|---|
| MyPlanIQ ETF Tactical Stock Allocation | -3.58% | 7.88% | 9.00% | 13.19% | 10.93% | 12.31% | 15.17% | 14.27% |
| VT (Vanguard Total World Stock ETF) | -0.42% | 11.58% | 10.02% | 13.25% | 8.69% | 9.09% | NA | 7.88% |
U.S. stocks only:
| Name | YTD Return | 1Yr AR | 3Yr AR | 5Yr AR | 10Yr AR | 15Yr AR | 20Yr AR | Inception |
|---|---|---|---|---|---|---|---|---|
| P Composite Momentum Scoring Factor ETFs | -3.48% | 13.52% | 13.24% | 15.66% | 13.35% | 13.71% | NA | 13.87% |
| P Composite Momentum Scoring Fidelity Select Funds | 7.09% | 19.93% | 14.03% | 18.22% | 13.80% | 13.14% | 15.56% | 13.94% |
| SPY (SPDR S&P 500 ETF Trust) | -5.10% | 11.88% | 11.81% | 15.48% | 12.20% | 12.86% | 10.17% | 10.30% |
You can see most of these data from Dashboard.
For a retirement plan like a 401(k) or 403(b) that can invest only in a limited set of options, our TAA strategy can be applied automatically once the plan with the given investment options is constructed. A TAA-based portfolio can then be created as a model portfolio for subscribers to follow in their investment accounts.
MyPlanIQ Strategic Asset Allocation (SAA) Strategy
Principles
Our SAA strategy is similar to other popular asset allocation strategies. We determine the asset allocations among major asset classes, including U.S. stocks, international developed market stocks, emerging market stocks, REITs, bonds, and commodities. For brokerage-based investment accounts, such as IRAs or taxable accounts, we use ultra-low-cost ETFs as candidate funds for each asset class. However, for retirement plan accounts such as 401(k) or 403(b) plans, a similar approach applies: an SAA-based portfolio can be automatically created and monitored.
The weights of the asset classes are determined both quantitatively and qualitatively. The quantitative component is based on the correlation and historical volatility of these asset classes, following a classic Modern Portfolio Theory (MPT) approach. However, based on our interpretation of secular trends, we may make slight adjustments to these weights as part of the qualitative component. These adjustments are minimal.
On the other hand, for candidate fund selection, we leverage our strong research and expertise in sub-assets and funds. For example, we often advocate using hedged international funds such as HEFA instead of unhedged options like EFA or VEA. We take a business investor’s approach to index investing, thus prefer business quality driven index funds. Furthermore, we prioritize quality industries or sectors in addition to broad-based indexes.
As a result, our SAA strategy–based model portfolios are expected to outperform basic asset allocation portfolios, such as lazy portfolios and template portfolios, over the long term.