 |
Vanguard ETF: |  |
7.4%* |
|
Diversified Core: | |
8.1%* |
|
Six Core Asset ETFs: | |
7.3%* |
Articles on FPNIX
- Portfolio Management: Best of Fixed Income Managers vs. Retirement Income ETFs
09/08/2011
Two defensive investment strategies useful in current stressful times are compared. The first is based on selecting the best bond fund every month or every quarter from a list of bond funds managed by Morningstar's 'Manager of the Year' P Bond Funds Momentum Based on Upgrading Fixed Income Managers of the Year`s Funds Monthly. These funds include PTTRX, TGLMX, WATFX, MWTRX, LSBDX, DODIX, FPNIX.
The second is Retirement Income ETFs that consists of a list of candidate dividend stock and bond ETFs including DVY, EMB, HYG, ICF, IDV, TIP, VIG, VWO.
The conclusion: the Fixed Income Managers of the Year is solid and has lower volatility, a good defensive strategy one should consider. Both of them are better alternatives than a broad based index such as S&P 500 (SPX) or total bond market index (AGG)
Read more from our SeekingAlpha's article:
Defensive Strategies In Stressful Times: The Best Of Fixed Income
Symbols: SPX, DVY, EMB, HYG, ICF, IDV, TIP, VIG, VWO, PTTRX, TGLMX, WATFX, MWTRX, LSBDX, DODIX, FPNIX, Retirement Investing, Dividend Stock, Retirement Income, Portfolio Management
- First Pacific Advisors (FPA) Bob Rodriguez: Another Crash Coming
06/08/2011
Robert Rodriguez is the CEO of First Pacific Advisors (FPA). He managed the famed FPA Capital (FPPTX) and FPA New Income (FPNIX). He was twice named Morningstar's fixed-income manager of the year (2001 & 2008).
After taking a one year sabbatical in 2010, he came back to find that the world was still the same: problems that caused the financial crisis in 2008 had not been resolved. Here are some key points he made in a recent Fortune Magazine's article on Rodriguez:
- U.S. debt as a percentage of GDP ratio (currently 64%) is massively underreported because it doesn't count off-balance-sheet entitlements such as Medicare, and debt owed by Fannie and Freddie. If you factor in those liabilities, the ratio will be over 500%!
- The situation isn't irreparable: both parties are not willing to take drastic measures, let alone we are approaching to the election year.
- FPA Capital (FPPTX) is now 30% in cash (he had that before 2008) and 38% in energy sector (XLE). He refused to buy other sectors and even long term or intermediate term bonds (LQD) (TLT), (IEF).
At the end, as what the article stated: " A former Republican, he describes himself as a "fiscal conservative but social moderate" who has grown disgusted with both parties: "I say, 'A pox on both their houses.'""
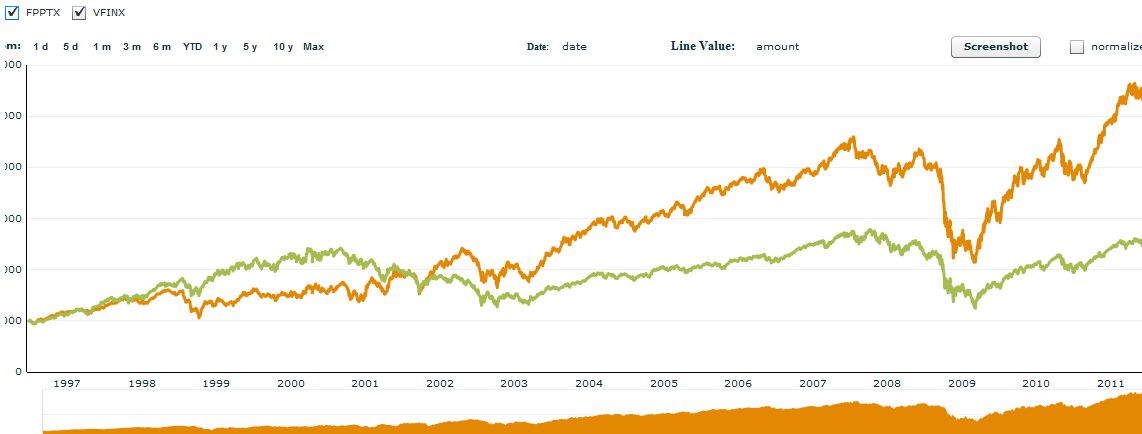
The following is the chart of FPPTX vs. VFINX (Vanguard 500 Index):
The following is the performance comparison between FPPTX and Six Core Asset ETFs Tactical Asset Allocation Moderate.
Portfolio Performance Comparison
Portfolio/Fund Name 1Yr AR 1Yr Sharpe 3Yr AR 3Yr Sharpe 5Yr AR 5Yr Sharpe FPPTX 39% 198% 8% 31% 7% 27% Six Core Asset ETFs Tactical Asset Allocation Moderate 16% 128% 9% 79% 15% 104%
See Here for more detailed comparison.See Here for another fund FPA Crecent's recent asset allocation analysis.
Symbols: SPY, TLT, XLE, IEF, FPPTX, FPNIX, VFINX
Exchange Tickers: (SPY), (TLT), (XLE), (IEF), (FPPTX), (FPNIX), (VFINX)
- How Are Morningstar's Best Bond Fund Managers Faring in These Trying Times
04/29/2011
Many working people put off their retirement investing -- just one more year until it has becomes a "hair on fire" problem. The problem is that we can easily be overwhelmed and shut down. The way to solve this is to focus on what works in the long term -- that is what long term investing is all about -- and allow that to filter out what may work in the short term but won't stand the test of time.
We continue to examine different portfolios to see what we can learn and use to further our investment portfolios.
This article reviews the best of bond strategy that we first published in November of last year. This outlined a strategy based on bond funds only It was simple: out of the seven top bond managers (according to Morningstar) own the top performing bond fund which you review on a monthly basis (or quarterly if you prefer). Every year we review the list of top performers and you update your list of funds to maintain only the top performers in your list. We will call this Best of Bonds (BoB).Currently, the top seven we use are:
Bond Fund
Ticker
PIMCO Total Return
TCW Total Return Bond
Western Asset Core Bond
Metropolitan West Total Return Bond
Loomis Sayles Bond
Dodge & Cox Income
FPA New Income
In a previous set of articles we tried to compete using bind ETFs such as BND, BWX, CIU, CMF, CSJ, IEF, JNK, LQD, MBB, MUB, NYF, PCY, SHV, SHY, TIP, TLH, TLT, WIP but we were unable match the returns of these managed bond funds. With PIMCO recently announcing a managed ETF bond fund, it will be interesting to see whether this gap will be filled.
We compare this against a portfolio of dividend bearing ETF's that we have reviewed and use as a recommended plan for those looking to invest for income.
Bonds have had a torrid time since the turn of the year with many tactical strategies moving to cash rather than staying in bond funds. With interest rates sticking to their lows and with QEII still in operation, there has been little joy for bond owners.
The comparison is
- Bond Funds Momentum Based on Upgrading Fixed Income Managers of the Year`s Funds Monthly
- Bond Funds Momentum Based on Upgrading Fixed Income Managers of the Year Quarterly
- Retirement Income ETFs Tactical Asset Allocation Moderate -- Above funds using TAA (40% fixed income, 30% for each of the top two asset classes)
- Retirement Income ETFs Strategic Asset Allocation Moderate -- Above funds using SAA (40% fixed income, 12% for each of the five asset classes -- funds selected based on price momentum)
Portfolio Performance Comparison
Portfolio/Fund Name 1Yr AR 1Yr Sharpe 3Yr AR 3Yr Sharpe 5Yr AR 5Yr Sharpe P Bond Funds Momentum Based on Upgrading Fixed Income Managers of the Year Quarterly 5% 85% 11% 194% 10% 164% P Bond Funds Momentum Based on Upgrading Fixed Income Managers of the Year`s Funds Monthly 6% 110% 12% 219% 11% 172% Retirement Income ETFs Strategic Asset Allocation Moderate 13% 96% 4% 16% 5% 23% Retirement Income ETFs Tactical Asset Allocation Moderate 7% 52% 10% 76% 10% 66%
Full details with drawdown and other parameters -- you can also add other portfolios for comparison
Three Month Chart (Blue is Quarterly)
One Year Chart (Blue is Quarterly)
Three Year Chart (Blue is Quarterly)
Five Year Chart (Blue is Quarterly)
Takeaways- Despite the challenging conditions, the Bond funds continue to deliver reasonable results in the short term and still look good over the longer time horizon
- The retirement income ETF tactical asset allocation has a similar long term performance but with more trading activity
- The strategic asset allocation has been doing well in the short term but suffered in the big downturn
The best of bonds is still a solid approach and with the advent of managed bond ETFs, it may be possible to have an ETF equivalent plan.
Disclosure:MyPlanIQ does not have any business relationship with the company or companies mentioned in this article. It does not set up their retirement plans. The performance data of portfolios mentioned above are obtained through historical simulation and are hypothetical.
Symbols: PTTRX, TGLMX, WATFX, MWTRX, LSBDX, DODIX, FPNIX, BND, BWX, CIU, CMF, CSJ, IEF, JNK, LQD, MBB, MUB, NYF, PCY, SHV, SHY, TIP, TLH, TLT, WIP