Dividend Stock ETFs Somewhat Defensive But Not Enough to Withstand Market Stress
03/17/2011 0 comments
The week ending on last Wednesday was not easy to investors: the biggest events in the week are the Japanese biggest earthquake in the last 20 years and its increasingly dangerous nuclear reactors meltdown (still unfolding). In the domestic economic side, the housing starts (home construction) in February plunged to the lowest level in almost a year, indicating the housing situation is yet to stabilize.
The performance of dividend stock ETFs for the week ending on Wednesday (3/16/2011) varied. Dividend ETFs clearly showed their defensive natures: for U.S. equity, the broadbase S&P 500 (SPY) dropped 4.7%, while SPDR S&P dividend (SDY) dropped 4.1%, iShares Dow Jones Dividend Select (DVY) dropped 4.2%. In fact, all of U.S. stock dividend ETFs fared better than S&P 500. A standout is the iShares S&P U.S. Preferred ETF (PFF), losing only 0.6%. Similarly, Powershares Intl Dividend Achievers (PID) did much better than broadbase MSCI index (EFA): -5.3% vs. -9.1%. For more detailed performance, please refer to here.
The following table shows the trend scores of dividend ETFs. A noticeable jump is for the Preferred ETF (PFF): it now rose from the last place to the middle in the table, indicating a clear defensive nature of the preferred stocks.
| Assets Class | Symbols | 03/16 Trend Score | 03/09 Trend Score | Direction |
|---|---|---|---|---|
| iShares Dow Jones US Real Estate | IYR | 4.65% | 9.61% | v |
| Vanguard Dividend Appreciation | VIG | 2.98% | 9.2% | v |
| SPDR S&P 500 | SPY | 2.79% | 9.41% | v |
| Vanguard High Dividend Yield Indx | VYM | 2.7% | 9.15% | v |
| iShares Dow Jones Select Dividend Index | DVY | 2.43% | 8.42% | v |
| iShares S&P U.S. Preferred Stock Index | PFF | 2.32% | 3.38% | v |
| First Trust Value Line Dividend Index | FVD | 1.91% | 8.22% | v |
| SPDR S&P Dividend | SDY | 1.74% | 7.95% | v |
| WisdomTree Emerging Market Equity Income | DEM | 1.66% | 8.12% | v |
| PowerShares Intl Dividend Achievers | PID | 1.01% | 7.84% | v |
| PowerShares HighYield Dividend Achievers | PEY | 0.12% | 7.11% | v |
| iShares MSCI Emerging Markets Index | EEM | -0.44% | 6.3% | v |
| iShares Dow Jones Intl Select Div Idx | IDV | -0.92% | 8.05% | v |
| SPDR DJ Wilshire Intl Real Estate | RWX | -1.47% | 9.74% | v |
| iShares MSCI EAFE Index | EFA | -4.57% | 6.48% | v |
The trend score is defined as the average of 1,4,13,26 and 52 week total returns (including dividend reinvested).
Portfolios that use dividend ETFs in place of broadbase stock index ETFs showed a slight advantage over a pure broadbase index ETFs based portfolios. For example, we introduced a retirement income ETF investment plan that uses dividend stock ETFs. The following chart shows the five day performance comparison between the Strategic Asset Allocation (SAA) moderate risk portfolio and a broadbased Five Core Asset ETF (SAA) moderate risk portfolio:
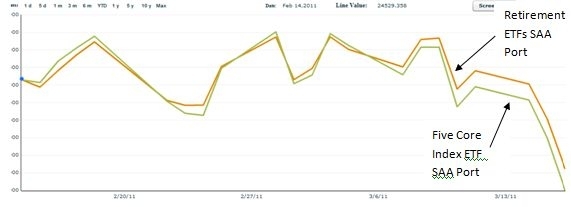
In fact, the dividend ETF plan's Strategic Asset Allocation (SAA) moderate risk portfolio had a big 28% drop in 2008. That shows one can not simply rely on dividend paying ETFs to avoid big loss.
If a more tactive Tactical Asset Allocation (TAA) strategy is used for these dividend ETFs, performance can be improved dramatically:
Portfolio Performance Comparison
| Portfolio Name | 1Yr AR | 1Yr Sharpe | 3Yr AR | 3Yr Sharpe | 5Yr AR | 5Yr Sharpe |
|---|---|---|---|---|---|---|
| Retirement Income ETFs Strategic Asset Allocation Moderate | 8% | 63% | 4% | 17% | 4% | 16% |
| Retirement Income ETFs Tactical Asset Allocation Moderate | 5% | 60% | 8% | 72% | 9% | 68% |
The takeaway is that dividend stock ETFs are more defensive in nature. However, to achieve greater risk reduction, a more active tactical asset allocation strategy should be employed.
Symbols: RWX,SPY,IYR,VIG,IDV,VYM,EEM,PID,EFA,FVD,DVY,PEY,SDY,PFF ,
Symbols: (NASDAQ: RWX), (NASDAQ: SPY), (NASDAQ: IYR), (NASDAQ: VIG), (NASDAQ: IDV), (NASDAQ: VYM), (NASDAQ: EEM), (NASDAQ: PID), (NASDAQ: EFA), (NASDAQ: FVD), (NASDAQ: DVY), (NASDAQ: PEY), (NASDAQ: SDY), (NASDAQ: PFF)
Disclosure:
MyPlanIQ does not have any business relationship with the company or companies mentioned in this article. It does not set up their retirement plans. The performance data of portfolios mentioned above are obtained through historical simulation and are hypothetical.
comments 0
Or Start FREE 30-day trial now >>
