Does an ETF ESIB Outperform the SIB in Tactical Asset Allocation Strategies
01/14/2011 0 comments
In a previous article introduced the extended SIB or ESIB. We have been
comparing its performance with the SIB in three class portfolios.
We compared the results with a strategic asset allocation:
| Portfolio Name | 1Yr AR | 1Yr Sharpe | 3Yr AR | 3Yr Sharpe | 5Yr AR | 5Yr Sharpe |
|---|---|---|---|---|---|---|
| ESIB-3 Strategic Asset Allocation Moderate | 11% | 112% | 2% | 11% | 4% | 23% |
| Three Core Asset ETF Index Funds Strategic Asset Allocation Moderate | 9% | 67% | 2% | 7% | 4% | 14% |
We noted that the returns were better in the short term but the long term results were similar enough that the extra trading may not be
worthwhile.
When we look at tactical asset allocation, the results are a little different.
Portfolio Performance Comparison
| Portfolio Name | 1Yr AR | 1Yr Sharpe | 3Yr AR | 3Yr Sharpe | 5Yr AR | 5Yr Sharpe |
|---|---|---|---|---|---|---|
| ESIB-3 Tactical Asset Allocation Moderate | -0% | -4% | 2% | 25% | 5% | 45% |
| Three Core Asset ETF Index Funds Tactical Asset Allocation Moderate | -3% | -28% | 2% | 18% | 4% | 30% |
We now compare trading behavior between the ESIB and SIB that enables the ESIB to have higher returns.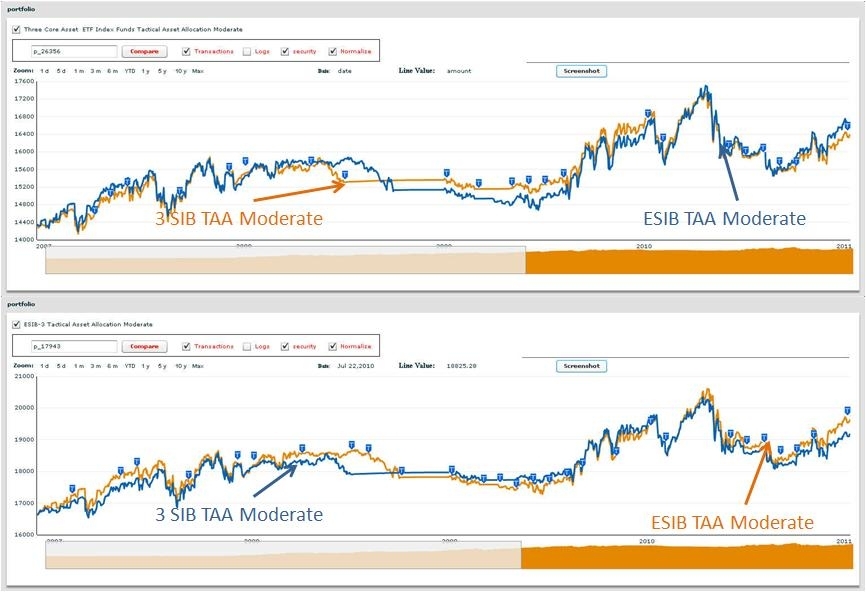
The two charts above show the transactions
based on the portfolios. The brown line (SIB in the top diagram, ESIB in the bottom) have the transactions marked with a blue shield. The SIB has 21
(SAA 13) transactions in the period whereas the ESIB has 29 (SAA 20).
We would have expected that the ability to optimize funds in each asset
class would give about a 1-2% additional return. While that has proven to be the case in the short term, over the long term the differences are less.
However, in this case, the additional activity does squeeze out extra returns over short and long horizons.
We note from a previous article that a four asset SIB -- one fund in each of
four asset classes beats the ESIB -- several funds in each of three asset classes and so moving to more asset classes is still the preferred path.
| Portfolio Name | 1Yr AR | 1Yr Sharpe | 3Yr AR | 3Yr Sharpe | 5Yr AR | 5Yr Sharpe |
|---|---|---|---|---|---|---|
| Four Core Asset ETF Index Funds Emerging Markets Tactical Asset Allocation Moderate | 1% | 12% | 6% | 60% | 11% | 70% |
| ESIB-3 Tactical Asset Allocation Moderate | 1% | 10% | 3% | 28% | 6% | 48% |
The results clearly justify moving to a simpler four asset class portfolio.
In the next article we will look at how SIBs and ESIBs behave with six class portfolios.
comments
0
![]()
Or Start FREE 30-day trial now >>
