Does an ETF ESIB Outperform the SIB in Buy and Hold Strategies?
01/14/2011 0 comments
A previous
article introduced the extended SIB or ESIB. An ESIB has multiple funds in each asset class. The purpose
is for each asset class to have a better opportunity to offset an underperforming asset class.
The ESIB3 comprises ten funds. These funds provide access to three major assets: US and foreign
equity and fixed income.
| Asset Class | Number of funds |
|---|---|
| REITs | 0 |
| Balanced Fund | 0 |
| Fixed Income | 5 |
| Commodity | 0 |
| Sector Fund | 0 |
| Foreign Equity | 2 |
| Emerging Market Equity | 0 |
| US Equity | 3 |
| Other | 0 |
| Total | 10 |
The impact of the additional funds in the portfolio increases the returns in both the long and short
term.
| Portfolio Name | 1Yr AR | 1Yr Sharpe | 3Yr AR | 3Yr Sharpe | 5Yr AR | 5Yr Sharpe |
|---|---|---|---|---|---|---|
| ESIB-3 Strategic Asset Allocation Moderate | 11% | 112% | 2% | 11% | 4% | 23% |
| Three Core Asset ETF Index Funds Strategic Asset Allocation Moderate | 9% | 67% | 2% | 7% | 4% | 14% |
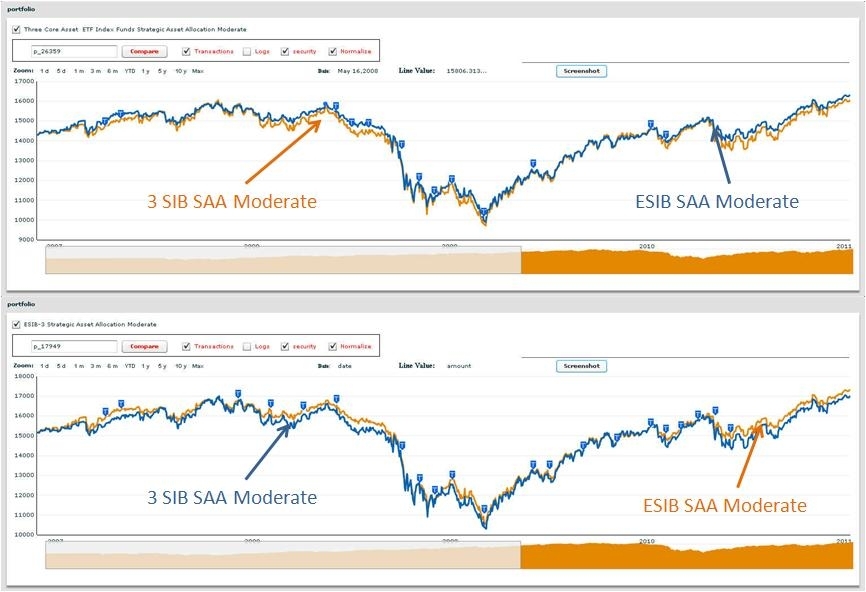
The
two charts above show the transactions based on the portfolios. The brown line (SIB in the top diagram, ESIB in the bottom) have the transactions marked with
a blue shield. The SIB has thirteen transactions in the period whereas the ESIB has twenty.
We would have expected that the ability to optimize
funds in each asset class would give about a 1-2% additional return. While that has proven to be the case in the short term, over the long term the
differences are less. Given the extra effort and costs (tax and commissions), the results are equivocal.
We note from a previous article that a four asset SIB -- one fund in each of four asset classes beats the ESIB -- several funds in each of three asset classes and so
moving to more asset classes is still the preferred path.
Takeaways:
comments
0
![]()
Or Start FREE 30-day trial now >>
