Core Satellite – A Way to Step Into Tactical Asset Allocation
10/19/2010 0 comments
Buy and hold asset allocation has become an almost unquestioned doctrine of long term investing. The emergence of modern portfolio theory in conjunction with a long bull market seemed to prove it largely infallible.
However, recent market events have put the approach under pressure and many are considering buy and hold insufficient without some additional hedges based on what we have seen and learned.
The comparison of returns from strategic and tactical asset allocation over the last five years clearly shows the dilemma. There is a significant benefit to having a tactical component to any portfolio.

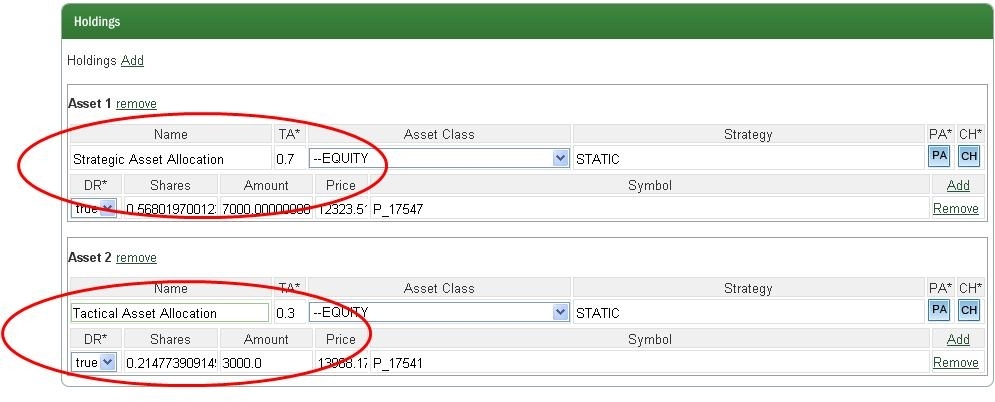
The portfolios will have six asset classes as they have an optimal level of performance traded off against the effort to maintain a large number of asset classes.
|
Index Funds Asset Class
|
Ticker
|
Name
|
|
Large Blend
|
VTSMX
|
Vanguard Total Stock Mkt Idx
|
|
Foreign Large Blend
|
VGTSX
|
Vanguard Total Intl Stock Index
|
|
Diversified Emerging Markets
|
VEIEX
|
Vanguard Emerging Mkts Stock Idx
|
|
Real Estate
|
VGSIX
|
Vanguard REIT Index
|
|
Commodities Broad Basket
|
DBC
|
PowerShares DB Commodity Idx Trking Fund
|
|
Intermediate-Term Bond
|
VBMFX
|
Vanguard Total Bond Market Index
|
|
ETF Asset Classes
|
Ticker
|
|
LARGE BLEND
|
VTI, SPY
|
|
Foreign Large Blend
|
VEU, EFA
|
|
Diversified Emerging Markets
|
VWO, EEM
|
|
Real Estate
|
VNQ, IYR
|
|
Commodities Broad Basket
|
DBC
|
|
Intermediate-Term Bond
|
BND, AGG
|
We are going to compare five portfolios:
- Tactical Asset Allocation only with 40% in fixed income
- Strategic Asset Allocation only with 40% in fixed income
- 50/50 Strategic/Tactical 40%
- 60/40 Strategic/Tactical 40%
- 70/30 Strategic/Tactical 40%
|
Portfolio Name
|
1Yr AR
|
3Yr AR
|
5Yr AR
|
|
10%
|
9%
|
14%
|
|
|
11%
|
6%
|
11%
|
|
|
11%
|
5%
|
10%
|
|
|
12%
|
4%
|
10%
|
|
|
13%
|
2%
|
7%
|
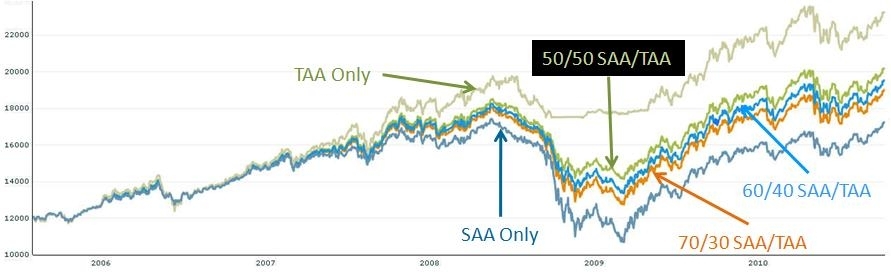
The results are much as expected with tactical asset allocation and strategic asset allocation bounding performance ranges and the core satellites filling in the middle.
The draw down ratios also behave as expected.
|
Portfolio/DD
|
1 Yr
|
3 Yr
|
5 Yr
|
Inception
|
|
TAA
|
10%
|
12%
|
14%
|
14%
|
|
50-50%
|
9%
|
24%
|
24%
|
24%
|
|
60-40
|
9%
|
27%
|
27%
|
27%
|
|
70-30
|
8%
|
29%
|
29%
|
29%
|
|
SAA
|
8%
|
39%
|
39%
|
39%
|
The concept of a core-satellite portfolio may appeal to many. The problem of constructing an measuring such a portfolio has been greatly simplified with analytical tools such as the MyPlanIQ system.
Takeaways
- In the current market conditions, tactical asset allocation still provides the best performance and has the lowest risk
- Those who want to move cautiously into momentum based portfolios can use core-satellite to dip their toe into the water
- ETF’s are an ideal, low cost vehicle to construct a core satellite portfolio
labels:investment,
Symbols:DBC,VBMFX,VTI,SPY,VEU,EFA,VWO,EEM,VNQ,IYR,BND,AGG,Portfolio-Building,with,ETFs,Closed-End,Funds,Commodity,ETFs,Developed,Market,ETFs,core-satellite,
comments 0
Or Start FREE 30-day trial now >>
