 |
Vanguard ETF: |  |
7.4%* |
|
Diversified Core: | |
8.1%* |
|
Six Core Asset ETFs: | |
7.3%* |
Articles on PHB
- ETF Based Bond Trend Indicators For The Week of November 15
11/15/2010
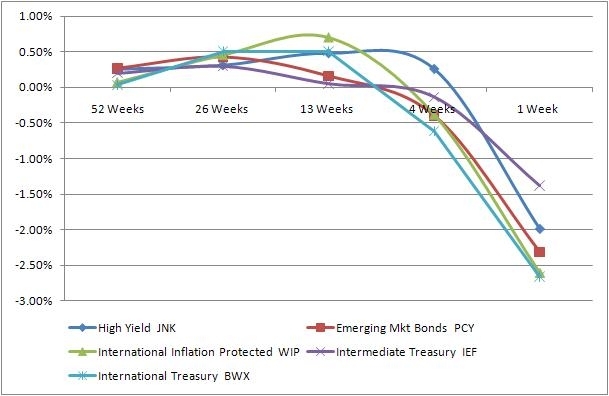
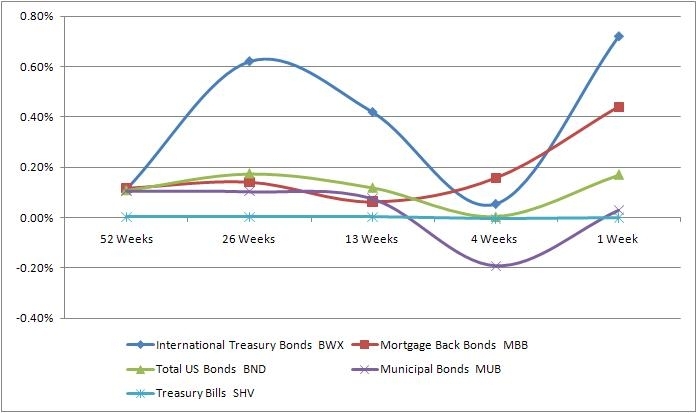
Fixed income is a key asset class categories in portfolio building. The main risks are represented by long/intermediate/short maturity bonds and high yield (junk), credit bonds. These indices provide important insight into debt market conditions that are key to asset allocation strategies. MyPlanIQ tracks detailed weekly bond trend movement. We use ETFs that represent the bond classes. For more information, please visit MyPlanIQ 360 Degree Market View.
The Federal Reserve's low rate policy has driven down bond yields to historical low. The Fed's QE2 announced last week showed Fed's committed action to maintain a long period of low rates to stimulate the economy. Investors should take a note on the 20+ year treasury bonds that has had trouble recently: reflecting a belief that eventually, Fed's action will result in much higher inflation. International fixed income bonds are rising because of the US dollar weakness.
Description
Symbol
15-Nov Trend Score
Direction
8-Nov Trend Score
High Yield
JNK
5%
v
8%
Emerging Mkt Bonds
PCY
5%
v
9%
International Inflation Protected
WIP
4%
v
7%
Intermediate Treasury
IEF
3%
v
5%
International Treasury
BWX
3%
v
6%
Long Term Credit
LQD
3%
v
5%
Intermediate Term Credit
CIU
3%
v
4%
Inflation Protected
TIP
2%
v
4%
10-20Year Treasury
TLH
2%
v
4%
MBS Bond
MBB
1%
v
2%
US Total Bond
BND
1%
v
2%
Short Term Credit
CSJ
1%
v
1%
Short Term Treasury
SHY
0%
v
1%
Treasury Bills
SHV
0%
v
0%
New York Muni
NYF
0%
v
2%
20+ Year Treasury
TLT
-1%
v
1%
National Muni
MUB
-1%
v
2%
California Muni
CMF
-1%
v
1%
Top Five Indicators
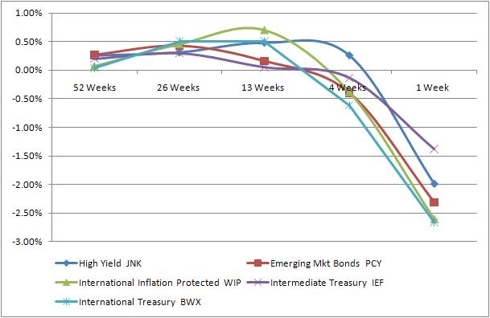
There is weakness across the board without any indication of what is
Bottom Five Indicators
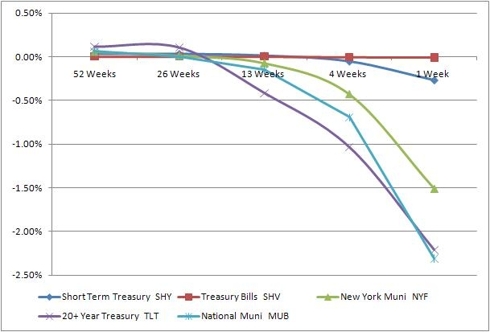
The worst performers are treasury bonds, especially in the 20+ year ones. Again, it is telling that investors definitely have a negative outlook in a long term for fixed income. Other bottom performers all have less risky nature, reflecting investors' chase for high yields and increasing risk appetite.
In conclusion, bonds in general continue to do well. Investors should keep an eye on such euphoria outlook and watch carefully on the possible turn that eventually will happen: exceptional low rates have to come with a price and can only sustain for so long.labels:investment,
Symbols:AGG,BND,SHV,SHY,IEF,TLH,TLT,TIP,WIP,HYG,JNK,PHB,CSJ,CIU,LQD,BWX,CMF,NYF,MUB,MBB,PCY,EMB,
- ETFs Provide Insight Into U.S. Sectors' Performance
11/12/2010
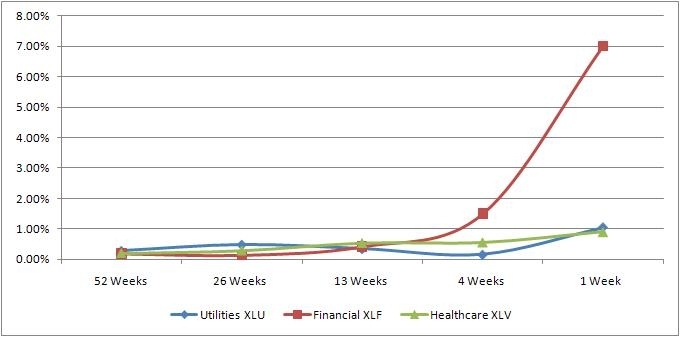
US sectors provide insight into the parts of the US economy that are flourishing or floundering. We are tracking the ETFs that represent ten different financial sectors.
More details are available on the MyPlanIQ website.
Description
Symbol
8-Nov Trend Score
Direction
Consumer Discretionary
(XLY)
14%
Week 1
Materials
(XLB)
13%
Week 1
Telecom
(IYZ)
13%
Week 1
Technology
(XLK)
12%
Week 1
Industries
(XLI)
11%
Week 1
Energy
(XLE)
10%
Week 1
Consumer Staples
(XLP)
7%
Week 1
Utilities
(XLU)
7%
Week 1
Financial
(XLF)
6%
Week 1
Healthcare
(XLV)
6%
Week 1
click to enlarge
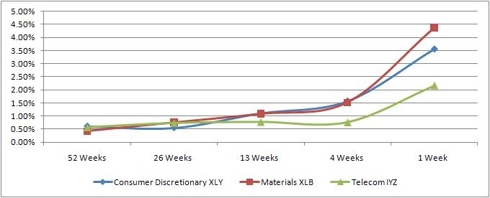
We are entering the holiday period with the QE2 wind at our backs. This is going to increase consumer confidence and consumer spending.
The materials and commodity sectors have jumped due to a weak dollar, which the QE2 program exacerbates. It is also likely to stimulate demand for materials further pushing up the price.
The telecom sector includes wireless phone providers and they will likely do well through the holiday period with the increasing success of smart phones.
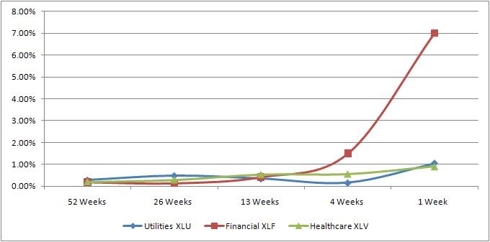
With the Republican victory in the House, some analysts are talking a lot these days about utilities stocks -- the reason being that the sector may benefit from the higher likelihood that the 15% tax rate on dividends will be extended.
The financial sector is still recovering from its meltdown and will continue to be under pressure with continuing concerns with mortgage stability and general fragility.
Healthcare's overall performance has been under pressure in this economic environment. Despite a substantial portion of their products being required for survival, sales remain sluggish. As a result, a wave of consolidation has gobbled up mid-cap companies with new products.
Some of these sectors will peak in the holiday season while others will settle over a longer time period as the political and economic climate evolves.
labels:investment,
Symbols:AGG,BND,CIU,CSJ,DBA,DBC,EEM,EFA,GSG,HYG,ICF,IEF,IWM,IYR,IYZ,JNK,LQD,MBB,MDY,MUB,PHB,QQQQ,SHV,SHY,SPY,TLT,USO,VEU,VNQ,VWO,XLB,XLE,XLF,XLI,XLK,XLP,XLU,XLV,XLY,
- International ETF's Give Insight on Global Economies
11/10/2010
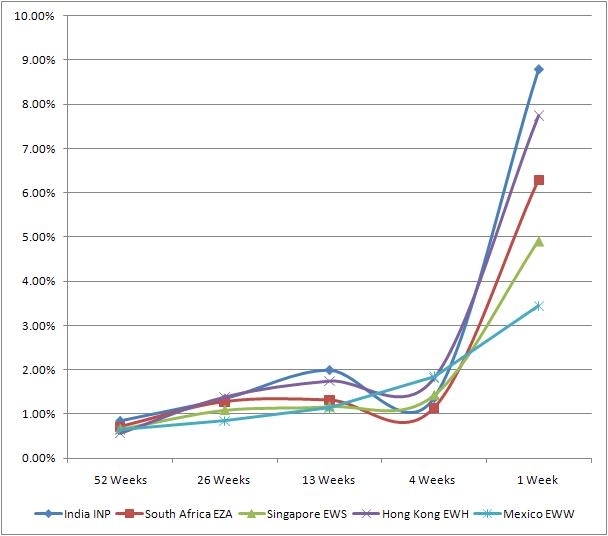
While the world is becoming more connected, local conditions prevail resulting in different economic returns. MyPlanIQ tracks detailed weekly country economic trend movement. We use ETFs that represent each geographic region and present the results here.
More details are available on the MyPlanIQ website.
The largest industrial nations are meeting in Seoul this week and one of the topics on the agenda is rebalancing global growth.Country Symbol 8-Nov Trend Score Direction India INP 57% Week 1 South Africa EZA 47% Week 1 Singapore EWS 43% Week 1 Hong Kong EWH 42% Week 1 Mexico EWW 41% Week 1 Malaysia EWM 40% Week 1 South Korea EWY 37% Week 1 Russia RSX 34% Week 1 Australia EWA 29% Week 1 Taiwan EWT 28% Week 1 Canada EWC 28% Week 1 Brazil EWZ 21% Week 1 Switzerland EWL 21% Week 1 Germany EWG 20% Week 1 United Kingdom EWU 20% Week 1 China FXI 19% Week 1 Belgium EWK 13% Week 1 The Netherlands EWN 13% Week 1 Japan EWJ 12% Week 1 France EWQ 9% Week 1 Austria EWO 9% Week 1 Italy EWI -7% Week 1 Spain EWP -17% Week 1
India continues its growth as the recent visit of President Obama signals. There is increasing pressure for India to open its markets to the US to make the relationship a two way street.
South African Finance Minister Pravin Gordhan said the U.S. decision to purchase bonds to pump money into the economy may push up the rand and cost jobs. Group of 20 nations meeting in South Korea this week need to agree on ways to stimulate their economies without damaging those of others.
SINGAPORE Airlines has reported a second-quarter profit of $380 million, reversing a $159 million loss during the same July-September period last year. The results were delivered on the back of a 18 per cent jump in revenue to $3.63 billion, as load factors and yields continued to improve, the airline said on Tuesday.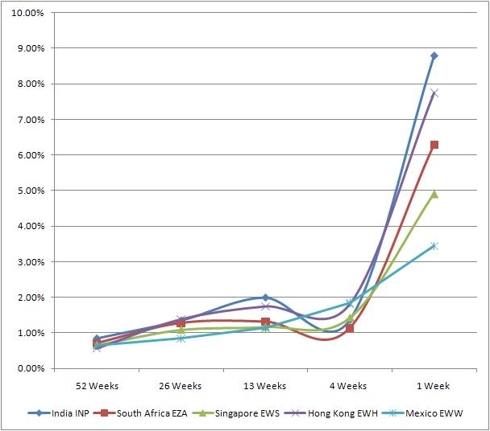
Hong Kong launched a campaign Monday to promote itself as a global financial hub and rejected suggestions that it was trying to counter growing competition from Shanghai.
President Felipe Calderón, declared his support for small and medium businesses, which produce 7 out of the 10 jobs in Mexico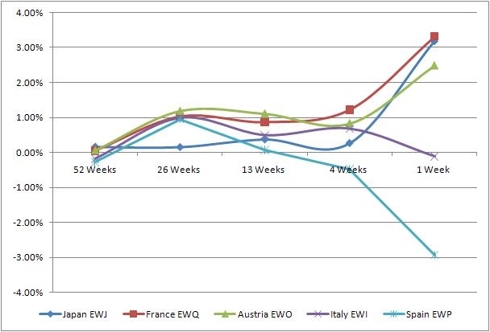
Japanese Prime Minister Naoto Kan on Tuesday pledged to bring Japan into the Trans-Pacific Strategic Economic Partnership Agreement, or TPP, saying the trade liberalization initiative will help the country return to a path of robust growth.
The Bank of France forecasts 0.5-percent fourth-quarter growth The French economy is struggling to put its strained public finances in order. There have been many protests about the move to increase the retirement age.
Recently the Austrian government greed to a rigid austerity budget which involves massive social cuts. At the same time, the government plans to raise taxes primarily for lower and middle income brackets.
Italy is the Eurozone's third largest economy, accounting for about 17% of GDP and has come through in reasonable shape. The banks are strong and Italians are Europe's best savers. Recently the the European Commission raised its growth forecast for Italy, projecting that faster export growth will see GDP expand by 1.1% this year up from 0.8% forecast in May.
Spain's troubled banking sector is back in the news again. Despite the apparently succesful stress tests carried out over the summer problems persist, and don't seem likely to go away soon. Foremost among these is the steady rise in problem loans which have now risen to an all-time high, potentially endangering the credit rating of the country's financial institutions, according to a recent report from the credit ratings agency Moody's.
In conclusion, the G20 meeting is the big ticket item this week and what results could impact the direction of the indicators.
labels:investment,
Symbols: INP,EZA,EWS,EWH,EWW,EWM,EWY,RSX,EWA,EWT,EWC,EWZ,EWL,EWG,EWU,FXI,EWK,EWN,EWJ,EWQ,EWO,EWI,EWP,SPY,QQQQ,IWM,MDY,EFA,VEU,EEM,VWO,IYR,ICF,VNQ,GSG,DBC,DBA,USO,LQD,CSJ,CIU,HYG,JNK,PHB,TLT,IEF,SHY,SHV,BND,AGG,MUB,MBB,
- ETF Based Major Asset Class Trend Indicators For The Week of November 8
11/08/2010
MyPlanIQ tracks major asset classes trend movement. Major asset trends provide insights into underlying economic and market segments and are critical to tactical asset allocation strategies. We use ETFs that represent the asset class indices. For more information, please visitMyPlanIQ 360 Degree Market View.
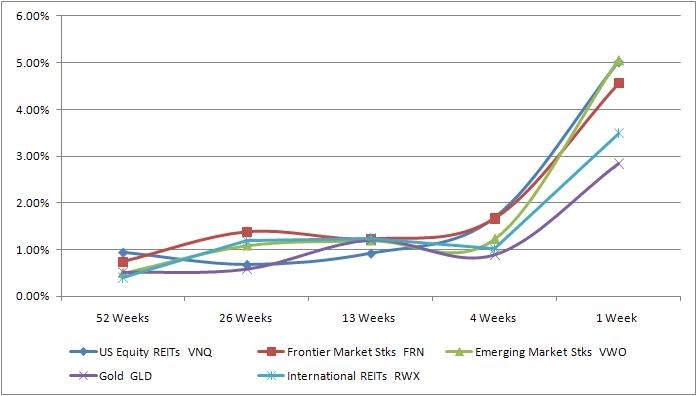
The Fed announced $600 billion treasury purchase, the so called QE2 that pushed most risk assets price higher. Risk assets like emerging market stocks, foreign stocks, US stocks, REITs and commodities had risen higher even before the announcement, partly due to QE2 anticipation and partly due to perceived improved economic conditions.
It is also believed that QE2 will result in US dollar devaluation and that in turns has led so called ‘commodity stockpiling’ propelling Gold and other commodities (such as agricultural commodities) to continue their recent ascent.
The only major trend change worth watching is the prices of long term treasury bonds, especially 10+ years which have continued weakness. It illustrates the market's belief that in the longer term, the Fed's actions will result in higher inflation.Asset Class Symbol 8-Nov Trend Score Direction US Equity REITs VNQ 57% ^ Frontier Market Stks FRN 47% ^ Emerging Market Stks VWO 34% ^ Gold GLD 32% v International REITs RWX 28% ^ US Stocks VTI 25% ^ Emerging Mkt Bonds PCY 20% ^ US High Yield Bonds JNK 19% ^ International Developed Stks EFA 15% ^ Intermediate Treasuries IEF 14% ^ Commodities GSG 11% ^ US Credit Bonds CFT 11% v International Treasury Bonds BWX 8% ^ Mortgage Back Bonds MBB 7% ^ Total US Bonds BND 6% ^ Municipal Bonds MUB 6% ^ Treasury Bills SHV 0% ^
Top Five Indicators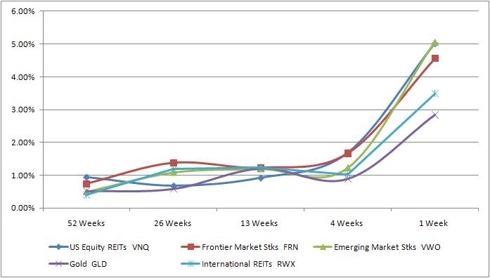
US REITs have been very strong all year, defying the perception of a weak real estate market. Emerging market and frontier markets continue their recent strength. Gold is approaching its all time high.
Bottom Five Indicators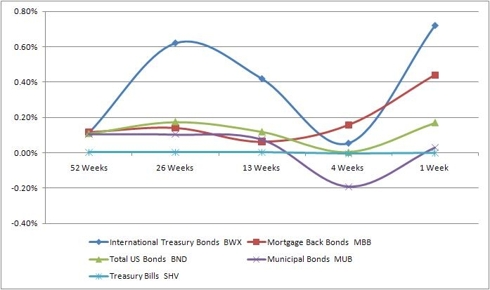
All the bottom five asset classes are fixed income, pointing to an increasing risk appetite.
In conclusion, other than long term treasury bonds, assets exhibit their continuous trends and have become stronger since QE2 announcement.labels:investment,
Symbols:EEM,VNQ,FRN,VWO,IYR,ICF,GLD,RWX,VTI,SPY,IWM,PCY,EMB,JNK,HYG,PHB,EFA,VEU,IEF,TLT,GSG,DBC,DBA,CFT,BWX,MBB,BND,MUB,SHV,AGG,
- Top Tier ETF Broker Finalists
10/28/2010
We have examined four ETF Providers, Schwab, Ameritrade, Vanguard and Fidelity.
Schwab and Fidelity were removed from the list as Ameritrade and Vanguard both had more asset classes and more funds with which to build a portfolio generating higher returns.
Ameritrade with 101 funds and Vanguard with 62 funds are left with the ability to go into deeper analysis to see whether the extra funds in Ameritrade deliver added value.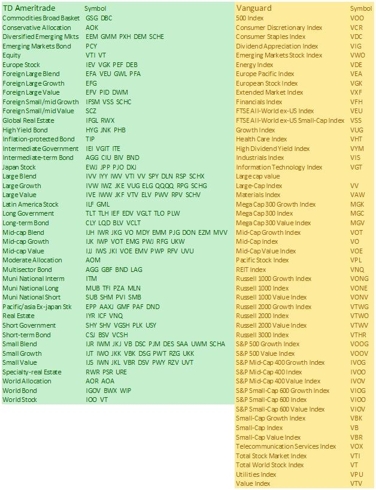
TD Ameritrade have multiple ETF's in each minor asset category whereas Vanguard does not. Both brokers offer a very broad range of US equities
Performance chart (as of Oct 25, 2010)Performance table (as of Oct 25, 2010)
Portfolio Name 1Yr AR 1Yr Sharpe 3Yr AR 3Yr Sharpe 5Yr AR 5Yr Sharpe Vanguard 62 Tactical Asset Allocation Moderate 14% 93% 5% 33% 13% 81% Vanguard 62 Strategic Asset Allocation Moderate 17% 126% 2% 5% 8% 42% TD Ameritrade Commission Free ETFs Tactical Asset Allocation Moderate 14% 96% 13% 84% 20% 128% TD Ameritrade Commission Free ETFs Strategic Asset Allocation Moderate 10% 89% -1% -10% 8% 44% labels:investment,
Symbols:SPY,VTI,EFA,VEU,EEM,VWO,IYR,VNQ,ICF,AGG,BND,HYG,JNK,PHB,CIU,BIV,GII,PUI,DBU,RYU,UPW,IYH,IXJ,VHT,XBI,PBE,DBR,RYH,IXP,PTE,DGG,LTL,IYM,IGE,VAW,XLB,XME,PYZ,DBN,RTM,UYM,MTK,PTF,DBT,RYT,ROM,GWL,PFA,IVE,IWW,JKF,VTV,ELV,PWV,RPV,SCHV,IYF,VFH,IPF,PFI,DRF,RYF,KXI,
- TD Ameritrade Commission Free ETF’s Empowers Both Strategic and Tactical Asset Allocation
10/19/2010
- Apple 401K: A Great Company with an Average Retirement Plan
10/19/2010
- Case Study: Hewlett Packard's 401K Plan
10/09/2010
- Google’s 401K Plan: Another Good Employee Benefit
09/26/2010
- Getting Most out of Your Retirement Plan: A Case Study on Hewlett Packard 401K Plan
09/16/2010


- Peabody Investments Corp.Employee Retirement Account Report On 12/03/2010
12/03/2010
This report reviews Peabody Investments Corp.Employee Retirement Account plan. We will discuss the investment choices and present the plan rating by MyPlanIQ. Current economic and market conditions are discussed in the context of the investment portfolios in the plan. We will then show how participants in Peabody Investments Corp.Employee Retirement Account can achieve reasonable investment results using asset allocation strategies.
Plan Review and Rating
Peabody Energy Corporation, through its subsidiaries, engages in the exploration, mining, and production of coal worldwide.
Peabody Investments Corp.Employee Retirement Account's 401K plan consists of 37 funds. These funds enable participants to gain exposure to 5 major assets: US Equity, Foreign Equity, Emerging Market Equity, REITs, Fixed Income. The list of minor asset classes covered:
Diversified Emerging Mkts: EEM, GMM, PXH, DEM, SCHE
Foreign Large Blend: EFA, VEU, GWL, PFA
Foreign Large Value: EFV, PID, DWM
High Yield Bond: HYG, JNK, PHB
Intermediate Government: IEI, VGIT, ITE
Intermediate-term Bond: AGG, CIU, BIV, BND
Large Blend: IVV, IYY, IWV, VTI, VV, SPY, DLN, RSP, SCHX
Large Growth: IVW, IWZ, JKE, VUG, ELG, QQQQ, RPG, SCHG
Large Value: IVE, IWW, JKF, VTV, ELV, PWV, RPV, SCHV
Long Government: TLT, TLH, IEF, EDV, VGLT, TLO, PLW
Long-term Bond: CLY, LQD, BLV, VCLT
Mid-cap Blend: IJH, IWR, JKG, VO, MDY, EMM, PJG, DON, EZM, MVV
Mid-cap Growth: IJK, IWP, VOT, EMG, PWJ, RFG, UKW
Real Estate: IYR, ICF, VNQ
Retirement Income:
Small Blend: IJR, IWM, JKJ, VB, DSC, PJM, DES, SAA, UWM, SCHA
Small Growth: IJT, IWO, JKK, VBK, DSG, PWT, RZG, UKK
Target Date 2000-2010: TZD
Target Date 2011-2015: TZE
Target Date 2016-2020: TZG
Target Date 2021-2025: TZI
Target Date 2026-2030: TZL
Target Date 2031-2035: TZO
Target Date 2036-2040: TZV
Target Date 2041-2045:
Target Date 2050+:
As of Dec 2, 2010, this plan investment choice is rated as based on MyPlanIQ Plan Rating methodology that measures the effectiveness of a plan's available investment funds. It has the following detailed ratings:
Diversification -- Rated as (89%)
Fund Quality -- Rated as (63%)
Portfolio Building -- Rated as (94%)
Overall Rating: (83%)Current Economic and Market Conditions
We have experienced an uncertain 2010: plenty of worries on whether the US economy will climb out of the great recession and recover.
- The Federal Reserve embarked on Quantitative Easing II (QE2) to stimulate the economy.
- The housing market is still at its low but largely stabilized.
- The unemployment rate is stuck at 9%.
Americans continue to face an uncertain future, given (among others) the high unemployment rate, large federal and local government debts and global trade imbalance. With such an economic backdrop, the stock and debt markets are going to be volatile. Despite this, markets have been resilient and appear positioned to rebound.
In this market it is even more critical to properly diversify and respond market changes. MyPlanIQ offers two asset allocation strategies: strategic and tactical asset allocation strategies ( SAA and TAA for participants in Peabody Investments Corp.Employee Retirement Account).
Strategic Asset Allocation is based on well known modern portfolio theory and its key features include: diversification, proper fund selection and periodically re-balancing.
Tactical Asset Allocation works on a diversified array of assets provided by funds in a plan and adjusts asset mixes based on market conditions such as asset price momentum utilized by TAA.
Portfolio Discussions
The chart and table below show the historical performance of moderate model portfolios employing strategic and tactical asset allocation strategies. For comparison purpose, we also include the moderate model portfolios of a typical 5 asset SIB (Simpler Is Better) plan . This SIB plan has the following candidate index funds and their ETFs equivalent:
US Equity: (SPY or VTI)
Foreign Equity: (EFA or VEU)
Emerging Market Equity: (EEM or VWO)
REITs: (IYR or VNQ or ICF)
Fixed Income: (AGG or BND)
Performance chart (as of Dec 2, 2010)Performance table (as of Dec 2, 2010)
Portfolio Name 1Yr AR 1Yr Sharpe 3Yr AR 3Yr Sharpe 5Yr AR 5Yr Sharpe Peabody Investments Corp.Employee Retirement Account Tactical Asset Allocation Moderate 13% 103% 8% 75% 13% 102% Peabody Investments Corp.Employee Retirement Account Strategic Asset Allocation Moderate 13% 141% 3% 18% 7% 41% Five Core Asset Index ETF Funds Tactical Asset Allocation Moderate 9% 59% 7% 57% 14% 94% Five Core Asset Index ETF Funds Strategic Asset Allocation Moderate 12% 95% 4% 14% 8% 35% Currently, asset classes in US Equity (SPY,VTI), Emerging Market Equity (EEM,VWO) and Fixed Income (AGG,BND) are doing relatively well. These asset classes are available to Peabody Investments Corp.Employee Retirement Account participants.
To summarize, Peabody Investments Corp.Employee Retirement Account plan participants can achieve reasonable investment returns by adopting asset allocation strategies that are tailored to their risk profiles.
Symbols: BTU , SPY , VTI , EFA , VEU , EEM , VWO , IYR , VNQ , ICF , AGG , BND , HYG , JNK , PHB , CIU , BIV , GWL , PFA , IVE , IWW , JKF , VTV , ELV , PWV , RPV , SCHV , EFV , PID , DWM , TZD , TZE , TZG , TZI , TZO , TZL , TZV , IVV , IYY , IWV , VV , DLN , RSP , SCHX , TLT , TLH , IEF , EDV , VGLT , TLO , PLW , IVW , IWZ , JKE , VUG , ELG , QQQQ , RPG , SCHG , IJH , IWR , JKG , VO , MDY , EMM , PJG , DON , EZM , MVV , IJR , IWM , JKJ , VB , DSC , PJM , DES , SAA , UWM , SCHA , GMM , PXH , DEM , SCHE , CLY , LQD , BLV , VCLT , IEI , VGIT , ITE , IJK , IWP , VOT , EMG , PWJ , RFG , UKW , IJT , IWO , JKK , VBK , DSG , PWT , RZG , UKK
- Capital Accumulation Plan of The Chubb Corporation Report On 12/03/2010
12/03/2010
- EQT CORPORATION SAVINGS AND PROTECTION PLAN Report On 12/03/2010
12/03/2010
- Vanguard Variable Annuity Report On 12/06/2010
12/06/2010
- TD Ameritrade Commission Free ETFs Report On 12/07/2010
12/07/2010
- Vanguard-VA-Clone Report On 12/07/2010
12/07/2010
- Sprint Nextel 401K Plan Report On 03/21/2011
03/21/2011