 |
Vanguard ETF: |  |
7.4%* |
|
Diversified Core: | |
8.1%* |
|
Six Core Asset ETFs: | |
7.3%* |
Articles on SPY
- Two Ways to Counter The Government's Financial Repression
06/10/2011
PIMCO was the first one who coined 'new normal' for the coming decades. They continue to fine tune their theory as time goes. In a recent report, PIMCO's CEO Mohamed El-Erian pointed out an ongoing financial repression the U.S. policy makers have adopted. The key points are
- "...excess liabilities have simply been shifted around the system, and importantly to public balance sheets and taxpayers."
- Higher inflation going forward
- Currency depression
- Uneven growth potential with developed countries slowly healing themselves while emerging markets commanding higher growth (not without much higher inflation risk)
- Both U.S. stocks and treasury bonds are not attractive at this moment: according to PIMCO's Bill Gross who stated at the Morningstar Investment Conference on Wednesday: "Stocks have come to the end of a "wonderful journey," and are now on their own, like "a baby bird just released from the nest." The journey Gross spoke of is the multi-decade decline in real interest rates, which have fueled bull markets across "risk assets," especially in equities and bonds.See here for more detail.
In a word, the financial repression penalizes savers and transfers wealth from a group to others.
Here are two ways one can adopt to counter what the governments are doing for you:
- Diversify: your investment plan should include global opportunities, in both risk and fixed income assets. That means your plan's candidate investment choices should include developed country stocks such as U.S. stocks (SPY), foreign stocks (EFA) and emerging market stocks (EEM). You should also include non traditional assets like commodities (DBC) and Real Estate Investment Trusts (REITs) (IYR) (VNQ). On fixed income side, include global and emerging market bond funds (BWX) (EMB)
- Be Nimble, Go Tactical: With uneven and bumpy road ahead, you have to drive adeptly. Re-balance regularly. Better fund selection or even changing asset mixes dynamically.
Check out TD Ameritrade Commission Free ETFs plan that consists of 101 ETFs. They cover 6 major asset classes and 44 minor asset classes. The major asset classes it covers are Emerging Market Equity, Foreign Equity, Fixed Income, US Equity, Commodity and REITs.
Here is the model portfolio performance comparison:
Portfolio Performance Comparison
Portfolio/Fund Name 1Yr AR 1Yr Sharpe 3Yr AR 3Yr Sharpe 5Yr AR 5Yr Sharpe VFINX 20% 128% 0% -0% 2% 4% VBINX 15% 164% 4% 20% 5% 23% TD Ameritrade Commission Free ETFs Tactical Asset Allocation Moderate 12% 99% 8% 54% 15% 94% TD Ameritrade Commission Free ETFs Strategic Asset Allocation Moderate 14% 178% -1% -8% 6% 26% Symbols: SPY, EFA, EEM, IYR, DBC, AGG, TLT, Portfolio Strategies
Disclaimer: MyPlanIQ does not have any business relationship with the company or companies mentioned in this article. It does not set up their retirement plans. The performance data of portfolios mentioned above are obtained through historical simulation and are hypothetical.
- First Pacific Advisors (FPA) Bob Rodriguez: Another Crash Coming
06/08/2011
Robert Rodriguez is the CEO of First Pacific Advisors (FPA). He managed the famed FPA Capital (FPPTX) and FPA New Income (FPNIX). He was twice named Morningstar's fixed-income manager of the year (2001 & 2008).
After taking a one year sabbatical in 2010, he came back to find that the world was still the same: problems that caused the financial crisis in 2008 had not been resolved. Here are some key points he made in a recent Fortune Magazine's article on Rodriguez:
- U.S. debt as a percentage of GDP ratio (currently 64%) is massively underreported because it doesn't count off-balance-sheet entitlements such as Medicare, and debt owed by Fannie and Freddie. If you factor in those liabilities, the ratio will be over 500%!
- The situation isn't irreparable: both parties are not willing to take drastic measures, let alone we are approaching to the election year.
- FPA Capital (FPPTX) is now 30% in cash (he had that before 2008) and 38% in energy sector (XLE). He refused to buy other sectors and even long term or intermediate term bonds (LQD) (TLT), (IEF).
At the end, as what the article stated: " A former Republican, he describes himself as a "fiscal conservative but social moderate" who has grown disgusted with both parties: "I say, 'A pox on both their houses.'""
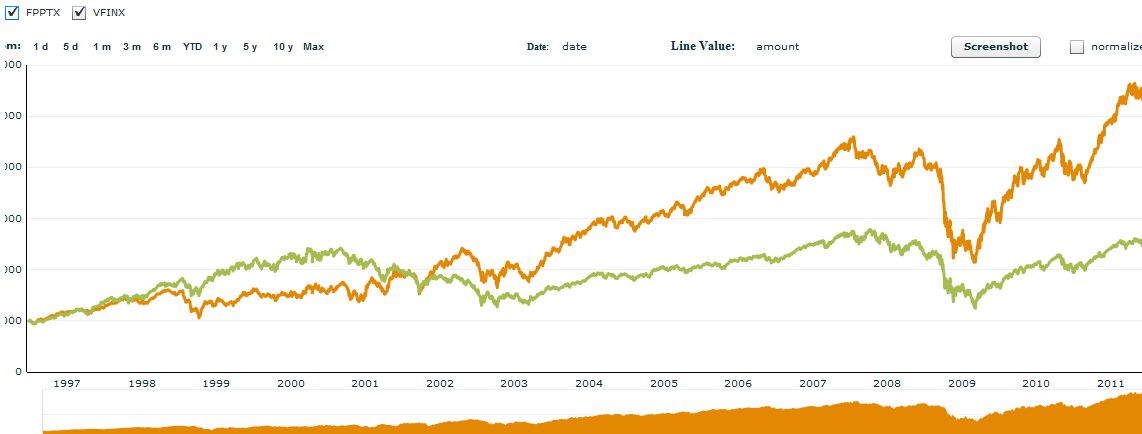
The following is the chart of FPPTX vs. VFINX (Vanguard 500 Index):
The following is the performance comparison between FPPTX and Six Core Asset ETFs Tactical Asset Allocation Moderate.
Portfolio Performance Comparison
Portfolio/Fund Name 1Yr AR 1Yr Sharpe 3Yr AR 3Yr Sharpe 5Yr AR 5Yr Sharpe FPPTX 39% 198% 8% 31% 7% 27% Six Core Asset ETFs Tactical Asset Allocation Moderate 16% 128% 9% 79% 15% 104%
See Here for more detailed comparison.See Here for another fund FPA Crecent's recent asset allocation analysis.
Symbols: SPY, TLT, XLE, IEF, FPPTX, FPNIX, VFINX
Exchange Tickers: (SPY), (TLT), (XLE), (IEF), (FPPTX), (FPNIX), (VFINX)
- Good Professor Siegel's WisdomTree ETF Lazy Portfolio Is Not That Good
06/08/2011
Paul Farrell at MarketWatch.com first proposed this portfolio in 2007. This portfolio uses all WisdomTree's fundamental weighted ETFs. Jeremy Siegel, a Yale Professor, is instrumental in constructing these ETFs. The following is the list of funds:
- 20% in DEFA Index (DWM)
- 15% in Total Dividend Index (DTD)
- 15% in Earnings Index (EXT)
- 10% in High-Yield Equity Index (DHS)
- 10% in DEFA High-Yield Equity Index (DTH)
- 10% in International Energy Sector (DKA)
- 10% in International Consumer Non-Cyclical Index (DPN)
- 10% in Low P/E Index (EZY)You can also find more information on Kirk's Report here.
These funds cover 2 major assets: US Equity, Foreign Equity.
The follow table compares the performance of the original portfolio (it is rebalanced annually) with those of strategic and tactical asset allocation portfolios with risk profile 0 (i.e. all equities). It is clear that the tactical asset allocation portfolio outperformed both the original and the strategic asset allocation.
Portfolio Name Strategy 1Yr AR 3Yr AR 5Yr AR
Strategic Asset Allocation 28% -2% 2% Tactical Asset Allocation 4% 2% 5% STATIC 13% -2% What is more interesting is that the original portfolio underperformed S&P 500 (SPY) (VFINX). The following table shows the comparison:
Annualized Return
Name
Last 1 Year
Last 3 Years
Last 5 Years
Professor Siegel`s Lazy WisdomTree ETFs Original Portfolio 13% -1% VFINX (Vanguard (S&P 500) Index) 20% 0% 2% VBINX (Vanguard Balance (60% stocks/40% bonds) 15% 4% 5% The first week of June has shown the continuously weakened stock markets reacted to a stream of bad economic news: the 9.1% unemployment rate, the disappointing ISM manufacturing survey and the double dip housing prices. Major risk asset prices were divergent, with U.S. stocks showing the major weakness. Fixed income markets continued to be strong.
- Among risk assets, commodities (DBC) (GLD) and international and U.S. REITs (RWX) (IYR) are still ranked at the top.
- Emerging market and developed market stocks (VWO) (EFA) actually edged out some gain.
- International treasury bond (BWX) is now ranked higher than both international and U.S. stocks now.
Fundamentally, we believe major problems that caused the financial crisis have not been fixed. We are in a long period of re-adjustment. For a long term or retirement investor, it is thus important to adjust portfolios accordingly.
To summarize, the WisdomTree ETFs portfolio proposed by Professor Siegel is not performing well. Investors should keep watchful eyes on some of those so called lazy portfolios and do their own due diligence.
Exchange Tickers: (DWM), (DTD), (EXT), (DHS), (DTH), (DKA), (DPN), (EZY), (VTI), (VEU), (BND)
Symbols: DWM, DTD, EXT, DHS, DTH, DKA, DPN, EZY, VTI, VEU, BND, SPY, EFA
- How To Guard Against Another Financial Crisis Around The Corner?
05/31/2011
Mark Mobius, executive chairman of Templeton's emerging markets group, has been bullish on emerging markets and in general, was optimistic on emerging market economies. Recently, he has sounded increasingly cautious on global economy.
At a recent gathering, he made the following points:
- Derivatives are not regulated and in fact, they are growing.
- The financial institutions are 'too big to fail'. They are even bigger today than pre-crisis.
- Business as usual, none of causes of the previous crisis has been resolved.
To summarize, Mobius stated that another financial crisis is around the corner. See here for a Bloomberg report.
So how to position your portfolios against the coming crisis (we know there will eventually be one, just don't know when)? The following are several measures to consider:
- Review your portfolio risk level: it is paramount to re-balance your portfolio to a risk level that you are comfortable with. You might want to ask yourself: what happens if the stock markets dropped 20-30% tomorrow? Can you withstand that? How about 40%?
- Diversify, diversify. Though when crisis happens, most likely all risk assets will dive synchronously, no two crisises are the same. Furthermore, it is critical to monitor fixed income, especially long bonds and credit (TED) spread. They can give you some early warnings. Right now, long bonds have risen since the ending of QE2, it is worth to monitor. See our recent SeekingAlpha article on this.
- Follow the economy, let markets tell you: at the moment, the economies have definitely slowed down. Risk assets are still at elevated levels. For now, it is a good idea to monitor major asset movements. MyPlanIQ market overview page lists updated major asset trend scores. When it is called for, one should be prepared to underweight risk asset exposures.
At the moment, hard currency such as Gold (GLD) is somewhat viewed as safe haven, along with U.S. treasury bonds (TLT). Recently, fixed income market has improved due to the series of bad news in economy. Total bond market index ETFs (AGG) (BND) have positive trend scores now.
It is also a good idea to monitor the simplest model portfolios that have six core asset ETFs as candidate funds (SPY) (EFA) (EEM) (IYR) (DBC) (AGG). These portfolios serve as barometers on how diversified and tactical portfolios have behaved recently. See Six Core Asset ETFs plan for more details.
Symbols: SPY, EFA, EEM, IYR, DBC, AGG, TLT, GLD, Portfolio Stategies
- US Large Cap Blend ETFs Return Can Be Beaten As Equity Markets Continue Ascent
05/05/2011
Large Cap Blend ETFs provide access to both growth and value stocks, looking for high returns while hedging that risk with more stable securities. Large Cap ETFs invest across the entire spectrum of the US market. Stocks in the top 70% of the capitalization of the US equity market are defined as large cap.
Despite strong returns, US Large Cap Blend ETFs, including the Russell Large Cap Index (IWB), have underperformed mid cap and small cap ETFs. With a one-year trend score of 8.52%, the Russell Large Cap Index falls towards the bottom of the US Style Return Table as seen below.
US Equity Style Return
4/29/2011
Assets Class Symbols 04/27
Trend
Score04/20
Trend
ScoreDirection Russell Smallcap Growth IWO 14.01% 13.06% ^ Russell Midcap Growth IWP 12.57% 11.91% ^ Russell Smallcap Index IWM 11.05% 9.92% ^ Russell Midcap Indedx IWR 10.9% 10.15% ^ Russell Midcap Value IWS 9.84% 9.03% ^ Russell Largecap Growth IWF 9.25% 8.24% ^ Russell Smallcap Value IWN 8.56% 7.26% ^ Russell Largecap Index IWB 8.52% 7.38% ^ Russell Largecap Value IWD 8.15% 6.96% ^ The trend score is defined as the average of 1,4,13,26 and 52 week total returns (including dividend reinvested).
US Large Cap Blend
4/29/2011
Description Symbol 1 Yr 3 Yr 5 Yr Avg. Volume(K) 1 Yr Sharpe SPDR S&P 500 SPY 15.13% 1.42% 2.64% 169,849 83.79% iShares S&P 500 Index IVV 14.66% 2.18% 2.45% 2,992 79.99% Vanguard Total Stock Market VTI 17.54% 3.35% 3.48% 1,833 92.09% iShares Russell 1000 IWB 15.83% 2.66% 2.84% 886 86.04% Rydex S&P Equal Weight RSP 18.18% 5.79% 4.44% 1,115 94.46% iShares S&P 100 OEF 12.47% 0.94% 2.15% 883 67.2% Vanguard Large Cap VV 15.8% 2.78% 3.54% 223 85.55% Schwab U.S. Large Cap SCHX 15.95% NA NA 297 87.97% Vanguard S&P 500 VOO NA NA NA 311 NA Among US Large Cap Blend ETFs the Ryder S&P Equal Weight ETF (RSP) and the Vanguard Total Stock Market ETF (VTI) have performed the strongest, offering one-year returns of 18.18% and 17.54% respectively. The ETF in the sector with the highest level of average volume, the SPDR S&P 500 Index, returned 15.13% in the past year, near the middle of the pack.
While US Large Cap Blend ETFs have provided investors with strong returns in recent periods, many in the market believe that the sector is due for a retraction based on overheated valuations. For the time being, investors will likely find better returns elsewhere.
Symbols: SPY, IVV, VTI, IWB, RSP, OEF, VV, SCHX, VOO, IWO, IWP, IWM, IWR, IWS, IWF, IWN, IWB, IWD
Tickers: (NYSE: SPY) (NYSE: IVV) (NYSE: VTI) (NYSE: IWB)(NYSE: RSP)(NYSE: OEF)(NYSE: VV)(NYSE: SCHX)(NYSE: VOO) (NYSE: IWO) (NYSE: IWP) (NYSE: IWM) (NYSE: IWR) (NYSE: IWS) (NYSE: IWF) (NYSE: IWN) (NYSE: IWB) (NYSE: IWD)Disclosure: MyPlanIQ does not have any business relationship with the company or companies mentioned in this article. It does not set up their retirement plans. The performance data of portfolios mentioned above are obtained through historical simulation and are hypothetical.
- Foreign Large Cap Equities Deliver Strong Returns Among Dividend Stock ETFs
05/04/2011
- Country ETFs: Germany leads the way up this week
04/30/2011
- Country ETFs: South Korea leads the way up
04/29/2011
- Madoff madness is our own
04/26/2011
- Do stocks make sense in the long run?
04/22/2011
- Keep It Simple Stupid -- A Simple Benchmark to Measure Your Investment Returns
04/19/2011
- Armstrong's Informed Investor Lazy Portfolio Feels The Commodities Pain
04/18/2011
- Leuthold Fund Uses Gold, Silver and Real Estate for Inflation Hedging
04/13/2011
- GMO’s Lean Investment Outlook
04/08/2011
- Japan Disaster -- Prevention is Better Than Cure -- How Does that Apply to Investing?
04/07/2011
- Will We Learn From Japan's Triple Tragedy?
04/07/2011
- Schwab Mutual Funds Beat out ETFs
04/06/2011
- Schwab Select ETF Plan Has Bright Prospects
04/06/2011
- National Semiconductor Provides Good Funds in Their Retirement Plan
04/04/2011
- MidAmerican Energy Company's 401K Plan: More Diversification Needed
03/31/2011
- Aflac Incorporated 401(k) Savings and Profit Sharing Plan Report On 12/03/2010
12/03/2010
This report reviews Aflac Incorporated 401(k) Savings and Profit Sharing Plan plan. We will discuss the investment choices and present the plan rating by MyPlanIQ. Current economic and market conditions are discussed in the context of the investment portfolios in the plan. We will then show how participants in Aflac Incorporated 401(k) Savings and Profit Sharing Plan can achieve reasonable investment results using asset allocation strategies.
Plan Review and Rating
AFLAC Inc (Ticker:AFL) has the "Aflac Incorporated 401(k) Savings and Profit Sharing Plan".
Aflac Incorporated 401(k) Savings and Profit Sharing Plan's 401K plan consists of 11 funds. These funds enable participants to gain exposure to 3 major assets: US Equity, Foreign Equity, Fixed Income. The list of minor asset classes covered:
Foreign Large Blend: EFA, VEU, GWL, PFA
Intermediate-term Bond: AGG, CIU, BIV, BND
Large Blend: IVV, IYY, IWV, VTI, VV, SPY, DLN, RSP, SCHX
Large Growth: IVW, IWZ, JKE, VUG, ELG, QQQQ, RPG, SCHG
Large Value: IVE, IWW, JKF, VTV, ELV, PWV, RPV, SCHV
Mid-cap Growth: IJK, IWP, VOT, EMG, PWJ, RFG, UKW
Moderate Allocation: AOM
Small Growth: IJT, IWO, JKK, VBK, DSG, PWT, RZG, UKK
As of Dec 2, 2010, this plan investment choice is rated as based on MyPlanIQ Plan Rating methodology that measures the effectiveness of a plan's available investment funds. It has the following detailed ratings:
Diversification -- Rated as (35%)
Fund Quality -- Rated as (33%)
Portfolio Building -- Rated as (36%)
Overall Rating: (35%)Current Economic and Market Conditions
We have experienced an uncertain 2010: plenty of worries on whether the US economy will climb out of the great recession and recover.
- The Federal Reserve embarked on Quantitative Easing II (QE2) to stimulate the economy.
- The housing market is still at its low but largely stabilized.
- The unemployment rate is stuck at 9%.
Americans continue to face an uncertain future, given (among others) the high unemployment rate, large federal and local government debts and global trade imbalance. With such an economic backdrop, the stock and debt markets are going to be volatile. Despite this, markets have been resilient and appear positioned to rebound.
In this market it is even more critical to properly diversify and respond market changes. MyPlanIQ offers two asset allocation strategies: strategic and tactical asset allocation strategies ( SAA and TAA for participants in Aflac Incorporated 401(k) Savings and Profit Sharing Plan).
Strategic Asset Allocation is based on well known modern portfolio theory and its key features include: diversification, proper fund selection and periodically re-balancing.
Tactical Asset Allocation works on a diversified array of assets provided by funds in a plan and adjusts asset mixes based on market conditions such as asset price momentum utilized by TAA.
Portfolio Discussions
The chart and table below show the historical performance of moderate model portfolios employing strategic and tactical asset allocation strategies. For comparison purpose, we also include the moderate model portfolios of a typical 3 asset SIB (Simpler Is Better) plan . This SIB plan has the following candidate index funds and their ETFs equivalent:
US Equity: (SPY or VTI)
Foreign Equity: (EFA or VEU)
Fixed Income: (AGG or BND)
Performance chart (as of Dec 2, 2010)Performance table (as of Dec 2, 2010)
Portfolio Name 1Yr AR 1Yr Sharpe 3Yr AR 3Yr Sharpe 5Yr AR 5Yr Sharpe Aflac Incorporated 401(k) Savings and Profit Sharing Plan Tactical Asset Allocation Moderate 4% 34% 5% 64% 8% 81% Aflac Incorporated 401(k) Savings and Profit Sharing Plan Strategic Asset Allocation Moderate 10% 100% 2% 8% 6% 31% Three Core Asset ETF Index Funds Tactical Asset Allocation Moderate -4% -35% 1% 9% 4% 27% Three Core Asset ETF Index Funds Strategic Asset Allocation Moderate 9% 60% -0% -3% 4% 13% Currently, asset classes in US Equity (SPY,VTI), Foreign Equity (EFA,VEU) and Fixed Income (AGG,BND) are doing relatively well. These asset classes are available to Aflac Incorporated 401(k) Savings and Profit Sharing Plan participants.
To summarize, Aflac Incorporated 401(k) Savings and Profit Sharing Plan plan participants can achieve reasonable investment returns by adopting asset allocation strategies that are tailored to their risk profiles.
Symbols: AFL , SPY , VTI , EFA , VEU , AGG , BND , AOM , CIU , BIV , GWL , PFA , IVE , IWW , JKF , VTV , ELV , PWV , RPV , SCHV , IVV , IYY , IWV , VV , DLN , RSP , SCHX , IVW , IWZ , JKE , VUG , ELG , QQQQ , RPG , SCHG , IJK , IWP , VOT , EMG , PWJ , RFG , UKW , IJT , IWO , JKK , VBK , DSG , PWT , RZG , UKK
- ALLERGAN, INC. SAVINGS AND INVESTMENT PLAN Report On 12/03/2010
12/03/2010
- Apartment Investment and Management Company 401(k) Retirement Plan Report On 12/03/2010
12/03/2010
- ASSURANT 401(k) PLAN A&PLAN B Report On 12/03/2010
12/03/2010
- Abercrombie Fitch Co. Savings and Retirement Plan Report On 12/03/2010
12/03/2010
- Apache Design Solutions 401K Report On 12/03/2010
12/03/2010
- Allegheny Ludlum Corporation Personal Retirement and 401(k) Savings Account Plan Report On 12/03/2010
12/03/2010
- AMERICAN EXPRESS RETIREMENT SAVINGS PLAN Report On 12/03/2010
12/03/2010
- ALLEGHENY ENERGY EMPLOYEE STOCK OWNERSHIP AND SAVINGS PLAN Report On 12/03/2010
12/03/2010
- BAKER 401(k) PLAN Report On 12/03/2010
12/03/2010
- BRISTOL-MYERS SQUIBB COMPANY SAVINGS AND INVESTMENT PROGRAM Report On 12/03/2010
12/03/2010
- PEABODY WESTERN-UMWA 401(K) PLAN Report On 12/03/2010
12/03/2010
- Peabody Investments Corp.Employee Retirement Account Report On 12/03/2010
12/03/2010
- Capital Accumulation Plan of The Chubb Corporation Report On 12/03/2010
12/03/2010
- CEPHALON, INC. 401(k) PROFIT SHARING PLAN Report On 12/03/2010
12/03/2010
- CABOT OIL & GAS CORPORATION SAVINGS INVESTMENT PLAN Report On 12/03/2010
12/03/2010
- CVS CAREMARK CORPORATION AND AFFILIATED COMPANIES Report On 12/03/2010
12/03/2010
- Danaher Corporation Subsidiaries Retirement and Savings Plan Report On 12/03/2010
12/03/2010
- Danaher Corporation Subsidiaries Savings Plan Report On 12/03/2010
12/03/2010
- EQT CORPORATION SAVINGS AND PROTECTION PLAN Report On 12/03/2010
12/03/2010
- Vanguard Variable Annuity Report On 12/06/2010
12/06/2010
- The Franklin Templeton NJBEST New Jersey 529 College Savings Plan Report On 12/07/2010
12/07/2010
- TD Ameritrade Commission Free ETFs Report On 12/07/2010
12/07/2010
- Qualcomm 401(k) Plan Report On 12/07/2010
12/07/2010
- Vanguard-VA-Clone Report On 12/07/2010
12/07/2010
- Tiffany Co. Employee Profit Sharing and Retirement Savings Plan Report On 03/21/2011
03/21/2011
- Sprint Nextel 401K Plan Report On 03/21/2011
03/21/2011
- Hewlett Packard 401K Report On 06/13/2011
06/13/2011
- Hewlett Packard 401K Report On 06232011
06/23/2011