ETF Based Bond Trend Indicators For The Week of November 15
11/15/2010 0 comments
|
Description |
Symbol |
15-Nov Trend Score |
Direction |
8-Nov Trend Score |
|
High Yield |
JNK |
5% |
v |
8% |
|
Emerging Mkt Bonds |
PCY |
5% |
v |
9% |
|
International Inflation Protected |
WIP |
4% |
v |
7% |
|
Intermediate Treasury |
IEF |
3% |
v |
5% |
|
International Treasury |
BWX |
3% |
v |
6% |
|
Long Term Credit |
LQD |
3% |
v |
5% |
|
Intermediate Term Credit |
CIU |
3% |
v |
4% |
|
Inflation Protected |
TIP |
2% |
v |
4% |
|
10-20Year Treasury |
TLH |
2% |
v |
4% |
|
MBS Bond |
MBB |
1% |
v |
2% |
|
US Total Bond |
BND |
1% |
v |
2% |
|
Short Term Credit |
CSJ |
1% |
v |
1% |
|
Short Term Treasury |
SHY |
0% |
v |
1% |
|
Treasury Bills |
SHV |
0% |
v |
0% |
|
New York Muni |
NYF |
0% |
v |
2% |
|
20+ Year Treasury |
TLT |
-1% |
v |
1% |
|
National Muni |
MUB |
-1% |
v |
2% |
|
California Muni |
CMF |
-1% |
v |
1% |
Top Five Indicators
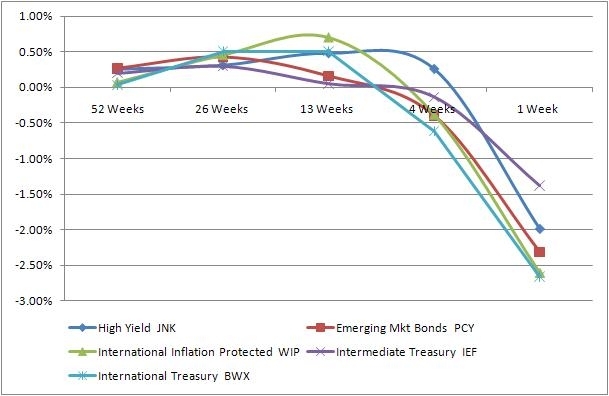
There is weakness across the board without any indication of what is
Bottom Five Indicators
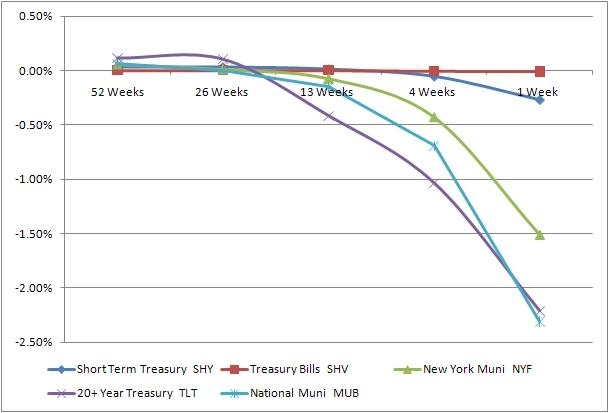
The worst performers are treasury bonds, especially in the 20+ year ones. Again, it is telling that investors definitely have a negative outlook in a long term for fixed income. Other bottom performers all have less risky nature, reflecting investors' chase for high yields and increasing risk appetite.
In conclusion, bonds in general continue to do well. Investors should keep an eye on such euphoria outlook and watch carefully on the possible turn that eventually will happen: exceptional low rates have to come with a price and can only sustain for so long.
labels:investment,
Symbols:AGG,BND,SHV,SHY,IEF,TLH,TLT,TIP,WIP,HYG,JNK,PHB,CSJ,CIU,LQD,BWX,CMF,NYF,MUB,MBB,PCY,EMB,
comments 0
Or Start FREE 30-day trial now >>
