 |
Vanguard ETF: |  |
7.4%* |
|
Diversified Core: | |
8.1%* |
|
Six Core Asset ETFs: | |
7.3%* |
Articles on JNK
- Commodity ETFs Show Muted Downturn This Week
11/20/2010
Commodities will play an increasingly important role as we climb out of the recent market mayhem and inflation becomes a reality. We track detailed weekly commodity trend movements.
Jeremy Grantham mentioned his belief that commodities will be a pressure point going forward.
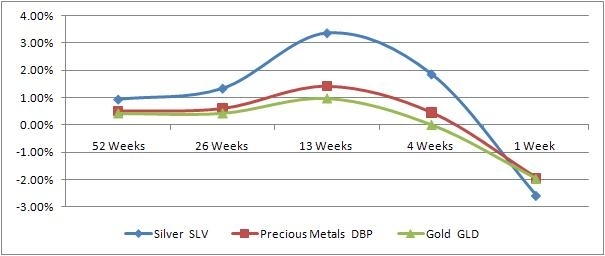
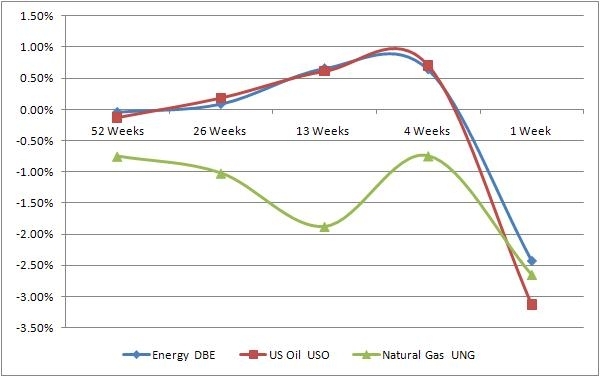
All the indices have been on a downward trend and commodities follow suit. However, the amount they are down is less than other indices.
Description
Symbol
15-Nov
Direction
8-Nov
Silver
(SLV)
26%
v
34%
Precious Metals
(DBP)
12%
v
17%
Gold
(GLD)
9%
v
13%
Base Metals
(DBB)
9%
v
13%
Agriculture
(DBA)
8%
v
14%
Commodity
(DBC)
6%
v
10%
Energy
(DBE)
2%
v
3%
US Oil
(USO)
1%
v
3%
Natural Gas
(UNG)
-19%
v
-18%
click to enlarge
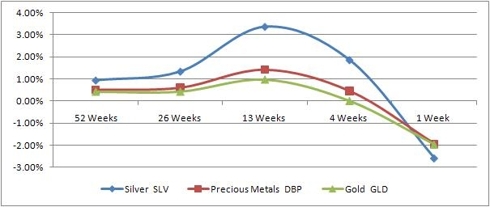
Silver drops below gold and precious metals. Gold has the most muted response with its dual role as currency backup and precious commodity to which people move in times of financial turbulence.
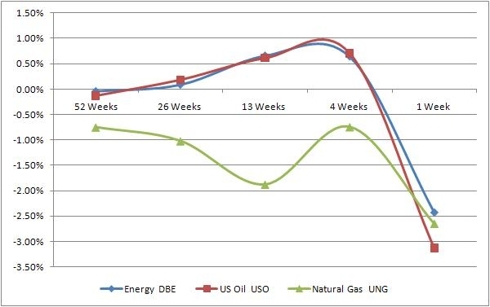
Energy and oil drop significantly as consumption may drop and natural gas continues its recent consistent decline.
Last week was a shock across the board, we have seen that commodities have been the least impacted and next week, we will see if there is any sort of rebound.
labels:investment,
Symbols:AGG,BND,CIU,CSJ,DBA,DBB,DBC,DBE,DBP,EEM,EFA,GLD,GSG,HYG,ICF,IEF,IWM,IYR,JNK,LQD,MBB,MDY,MUB,PHB,QQQQ,SHV,SHY,SLV,SPY,TLT,UNG,USO,VEU,VNQ,VWO,
- Top US Sectors Weather the week well -- bottom half feels the pain
11/19/2010
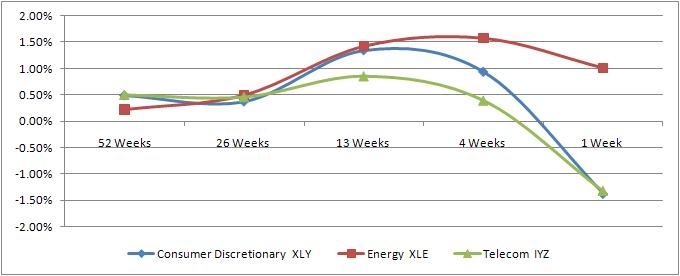
US sectors provide insight into the parts of the US economy that are flourishing or floundering. We are tracking the ETF's that represent ten different financial sectors.
More details are available on the MyPlanIQ website.Description
Symbol
15-Nov
Direction
8-Nov
Consumer Discretionary
XLY
11%
v
14%
Energy
XLE
10%
^
10%
Telecom
IYZ
10%
v
13%
Materials
XLB
9%
v
13%
Industries
XLI
7%
v
11%
Technology
XLK
7%
v
12%
Consumer Staples
XLP
5%
v
7%
Utilities
XLU
3%
v
7%
Healthcare
XLV
3%
v
6%
Financial
XLF
1%
v
6%
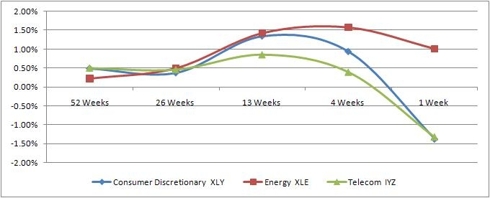
We are observing the same drops as the other indices we are tracking. Materials moved out of the top three to be replaced by energy which was the only marker to have a gain last week. The weather pays no attention to financial conditions and we are entering into the cold season in the northern hemisphere where the majority of the energy is consumed.
Telecom was hit by a gloomy Cisco forecast but that is offset by the growth in smart cell phones. Consumer discretionary held up reasonably well as there is still a belief that the Holiday season will be stronger than last year,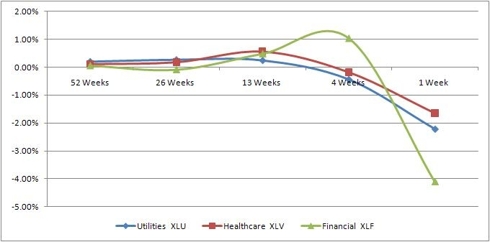
Utilities and healthcare continue their downward move as they will continue to be under pressure from increasing costs and a consumer who is very concerned about cost.
The financial sector continues to be under pressure with concerns on stability, currency fluctuations and mortgages.labels:investment,
Symbols:XLY,IYZ,XLI,XLB,XLK,XLE,XLF,XLP,XLU,XLV,SPY,QQQQ,IWM,MDY,EFA,VEU,EEM,VWO,IYR,ICF,VNQ,GSG,DBC,DBA,USO,LQD,CSJ,CIU,HYG,JNK,PHB,TLT,IEF,SHY,SHV,BND,AGG,MUB,MBB,
- Using Morningstar's Top Bond Manager to Build a Low Stress Portfolio
11/19/2010
Conventional wisdom is that risk based assets as the main engine of portfolio growth. While this remains true in the long run, recent history has caused us to question some of the concepts we thought sacrosanct.
We present here a very simple investment strategy -- pick the top five bond managers and own the top performing bond fund which you review on a monthly basis (or quarterly if you prefer).
Every year you review the list of top performers and you update your list of funds to maintain only the top performers in your list. We will call this Best of Bonds (BoB).Bond Fund
Ticker
PIMCO Total Return
TCW Total Return Bond
Western Asset Core Bond
Metropolitan West Total Return Bond
Loomis Sayles Bond
Dodge & Cox Income
FPA New Income
We built a portfolio of these funds and every month we scored the funds and selected the best fund.
We will then compare this with a Five asset class SIB (Simpler is Better) that has
index funds for five different asset classes and is an ideal benchmarking vehicle.
Portfolio Performance ComparisonPortfolio Name 1Yr AR 1Yr Sharpe 3Yr AR 3Yr Sharpe 5Yr AR 5Yr Sharpe P Bond Funds Momentum Based on Upgrading Fixed Income Managers of the Year`s Funds Monthly 9% 194% 12% 199% 11% 165% Five Core Asset Index Funds Tactical Asset Allocation Moderate 8% 58% 7% 57% 12% 98% Five Core Asset Index Funds Strategic Asset Allocation Moderate 13% 100% 2% 9% 7% 34%
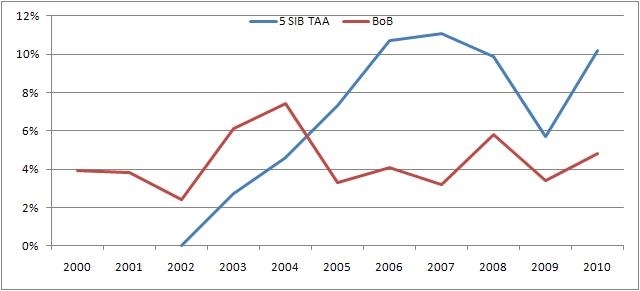
So BoB delivers very reasonable returns over the period -- comparable with a five asset class portfolio using tactical asset allocation.
The benefit is going to be peace of mind -- or lack of volatility.
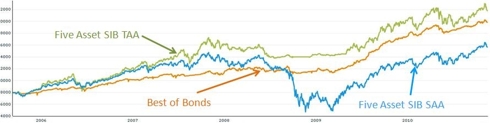
Comparison of Drawdown ratios between 5SIB TAA and BoB

This comparison of the drawdown ratios over the last decade between the SIB and BoB shows that BoB is going to be easier to live with.
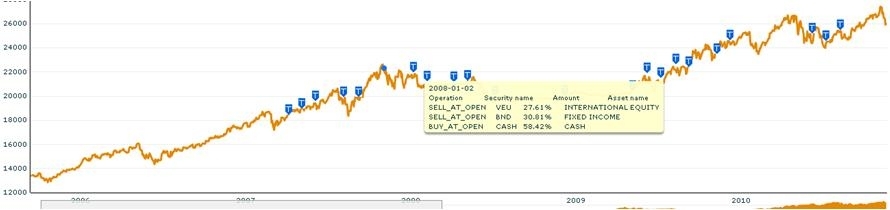
We can also look at the BoB's transaction history
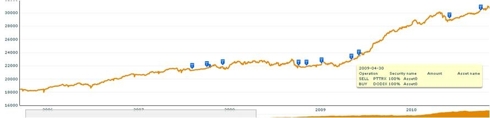
Compared to the Five SIB History
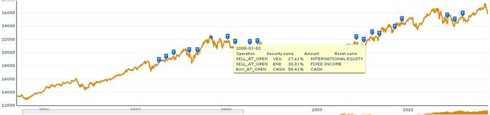
We can see from this that there has been less trading activity -- making it a lazier portfolio and easier to manage. Of course this is not guaranteed going forward.
Note that this is a simple strategy but it does not follow the classical diversification of risk based and fixed income assets.
In the next article we will look into the bond fund that is currently being held in this portfolio and compare it with the bond trends that track the movement of different bond styles.labels:investment,
Symbols:PCY,JNK,TLH,IEF,LQD,CIU,TIP,WIP,TLT,MBB,BWX,BND,MUB,CMF,NYF,CSJ,SHY,SHV,
- Commodity Indicators for Week of November 15th
11/17/2010
Commodities will play an increasingly important role as we climb out of the recent market mahem and inflation becomes a reality. MyPlanIQ tracks detailed weekly commodity trend movement. We use ETFs that represent commodity subgroups including agriculture, precious metals, base metals, energy and present the results here.
More details are available on the MyPlanIQ website.
Commodities can almost be split in two -- precious metals that react to currency devaluation and the rest which will be impacted by inflation and economic growth.
Most of the indicators are positive as we see turbulence in the currency markets, forecasts of a cold winter and the expectation that supplies will be tight as various economic stimulus packages spur growth.Description
Symbol
15-Nov
Direction
8-Nov
Silver
SLV
26%
v
34%
Precious Metals
DBP
12%
v
17%
Gold
GLD
9%
v
13%
Base Metals
DBB
9%
v
13%
Agriculture
DBA
8%
v
14%
Commodity
DBC
6%
v
10%
Energy
DBE
2%
v
3%
US Oil
USO
1%
v
3%
Natural Gas
UNG
-19%
v
-18%
Precious metals are increasingly being seen as a currency reference point as a range of currencies that were once standards are going to be under pressure as national debt forces stringent responses. This is likely to continue for some time.
As we enter winter, the demand for oil and energy will increase, driving prices higher. This will also be impacted by the dollar as oil is traded in that currency.
Natural gas is held in check by large stockpiles reducing the liklihood of any type of shortfall even if the winter turns out to be as cold as forecasted.labels:investment,
Symbols:SLV,DBP,GLD,DBB,DBA,DBC,DBE,USO,UNG,SPY,QQQQ,IWM,MDY,EFA,VEU,EEM,VWO,IYR,ICF,VNQ,GSG,LQD,CSJ,CIU,HYG,JNK,PHB,TLT,IEF,SHY,SHV,BND,AGG,MUB,MBB,
- Where is the Smart Money Going
11/17/2010
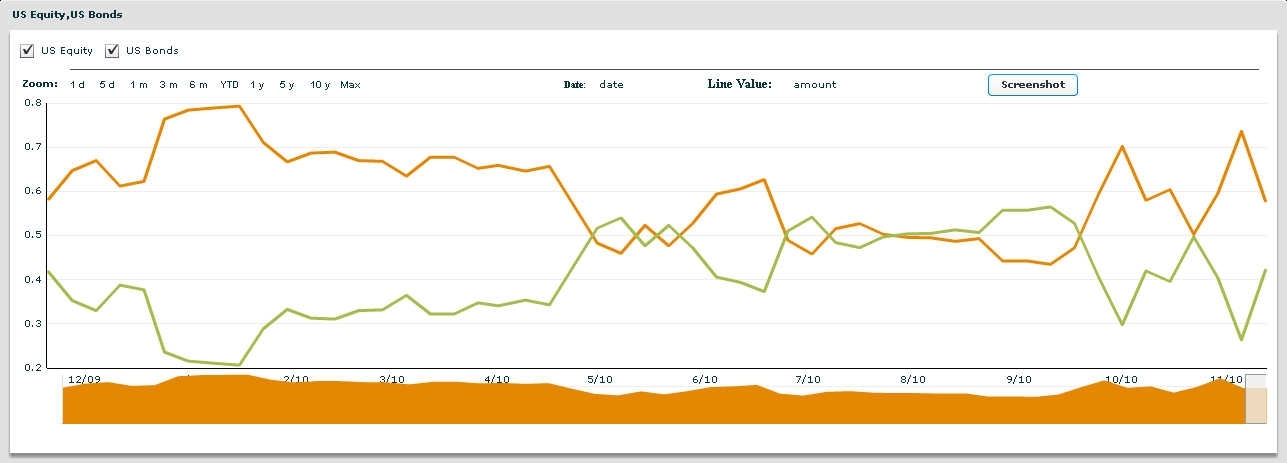
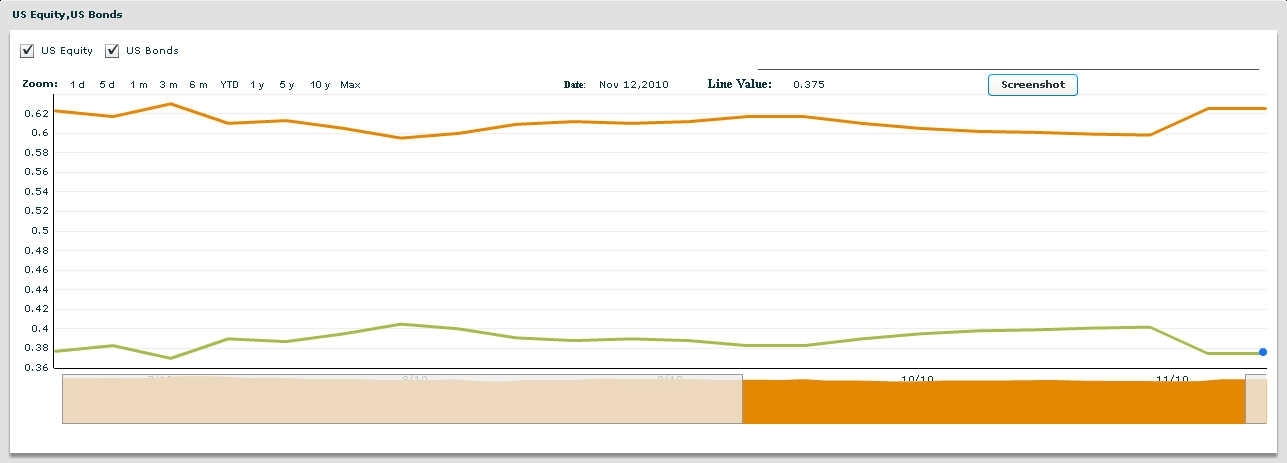
We are initiating coverage of where moderate allocation funds are putting their money. This will give an indication of whether fund managers are being more conservative or aggressive this week.
We track two separate indicators:
-
We review and assign the top 3 Moderate Allocation Funds. We then track their exposure to fixed income and risk based assets. This is calculated weekly and covers the last one year.
-
We then aggregate the exposure to fixed income and risk based assets of all Moderate Allocation Funds. It is calculated weekly and covers the last one year.
click to enlarge

We can see some big variations over the past year and considerable recent volatility. We can see the impact of QE2 driving equities up and then the weakness towards the end of the weak as most indices fell. There would be a more defensive move to fixed income assets.
At this point, the balance is marginally defensive.

The aggregate group is not reacting to the changes -- the moderate portfolios have become slightly more aggressive. This may change if the current sentiment continues.
labels:investment,
Symbols:SPY,QQQQ,IWM,MDY,EFA,VEU,EEM,VWO,IYR,ICF,VNQ,GSG,DBC,DBA,USO,LQD,CSJ,CIU,HYG,JNK,PHB,TLT,IEF,SHY,SHV,BND,AGG,MUB,MBB,
-
- Countries All Drop -- India significantly, Japan only a little
11/16/2010
- ETF Based Major Asset Class Trend Indicators For The Week of November 15
11/15/2010
- ETF Based Bond Trend Indicators For The Week of November 15
11/15/2010
- ETFs Provide Insight Into U.S. Sectors' Performance
11/12/2010
- International ETF's Give Insight on Global Economies
11/10/2010
- ETF Based Major Asset Class Trend Indicators For The Week of November 8
11/08/2010
- Top Tier ETF Broker Finalists
10/28/2010
- TD Ameritrade Commission Free ETF’s Empowers Both Strategic and Tactical Asset Allocation
10/19/2010
- Apple 401K: A Great Company with an Average Retirement Plan
10/19/2010
- Case Study: Hewlett Packard's 401K Plan
10/09/2010
- Google’s 401K Plan: Another Good Employee Benefit
09/26/2010
- Getting Most out of Your Retirement Plan: A Case Study on Hewlett Packard 401K Plan
09/16/2010
- Schwab ETFs Review
07/27/2010


- Peabody Investments Corp.Employee Retirement Account Report On 12/03/2010
12/03/2010
This report reviews Peabody Investments Corp.Employee Retirement Account plan. We will discuss the investment choices and present the plan rating by MyPlanIQ. Current economic and market conditions are discussed in the context of the investment portfolios in the plan. We will then show how participants in Peabody Investments Corp.Employee Retirement Account can achieve reasonable investment results using asset allocation strategies.
Plan Review and Rating
Peabody Energy Corporation, through its subsidiaries, engages in the exploration, mining, and production of coal worldwide.
Peabody Investments Corp.Employee Retirement Account's 401K plan consists of 37 funds. These funds enable participants to gain exposure to 5 major assets: US Equity, Foreign Equity, Emerging Market Equity, REITs, Fixed Income. The list of minor asset classes covered:
Diversified Emerging Mkts: EEM, GMM, PXH, DEM, SCHE
Foreign Large Blend: EFA, VEU, GWL, PFA
Foreign Large Value: EFV, PID, DWM
High Yield Bond: HYG, JNK, PHB
Intermediate Government: IEI, VGIT, ITE
Intermediate-term Bond: AGG, CIU, BIV, BND
Large Blend: IVV, IYY, IWV, VTI, VV, SPY, DLN, RSP, SCHX
Large Growth: IVW, IWZ, JKE, VUG, ELG, QQQQ, RPG, SCHG
Large Value: IVE, IWW, JKF, VTV, ELV, PWV, RPV, SCHV
Long Government: TLT, TLH, IEF, EDV, VGLT, TLO, PLW
Long-term Bond: CLY, LQD, BLV, VCLT
Mid-cap Blend: IJH, IWR, JKG, VO, MDY, EMM, PJG, DON, EZM, MVV
Mid-cap Growth: IJK, IWP, VOT, EMG, PWJ, RFG, UKW
Real Estate: IYR, ICF, VNQ
Retirement Income:
Small Blend: IJR, IWM, JKJ, VB, DSC, PJM, DES, SAA, UWM, SCHA
Small Growth: IJT, IWO, JKK, VBK, DSG, PWT, RZG, UKK
Target Date 2000-2010: TZD
Target Date 2011-2015: TZE
Target Date 2016-2020: TZG
Target Date 2021-2025: TZI
Target Date 2026-2030: TZL
Target Date 2031-2035: TZO
Target Date 2036-2040: TZV
Target Date 2041-2045:
Target Date 2050+:
As of Dec 2, 2010, this plan investment choice is rated as based on MyPlanIQ Plan Rating methodology that measures the effectiveness of a plan's available investment funds. It has the following detailed ratings:
Diversification -- Rated as (89%)
Fund Quality -- Rated as (63%)
Portfolio Building -- Rated as (94%)
Overall Rating: (83%)Current Economic and Market Conditions
We have experienced an uncertain 2010: plenty of worries on whether the US economy will climb out of the great recession and recover.
- The Federal Reserve embarked on Quantitative Easing II (QE2) to stimulate the economy.
- The housing market is still at its low but largely stabilized.
- The unemployment rate is stuck at 9%.
Americans continue to face an uncertain future, given (among others) the high unemployment rate, large federal and local government debts and global trade imbalance. With such an economic backdrop, the stock and debt markets are going to be volatile. Despite this, markets have been resilient and appear positioned to rebound.
In this market it is even more critical to properly diversify and respond market changes. MyPlanIQ offers two asset allocation strategies: strategic and tactical asset allocation strategies ( SAA and TAA for participants in Peabody Investments Corp.Employee Retirement Account).
Strategic Asset Allocation is based on well known modern portfolio theory and its key features include: diversification, proper fund selection and periodically re-balancing.
Tactical Asset Allocation works on a diversified array of assets provided by funds in a plan and adjusts asset mixes based on market conditions such as asset price momentum utilized by TAA.
Portfolio Discussions
The chart and table below show the historical performance of moderate model portfolios employing strategic and tactical asset allocation strategies. For comparison purpose, we also include the moderate model portfolios of a typical 5 asset SIB (Simpler Is Better) plan . This SIB plan has the following candidate index funds and their ETFs equivalent:
US Equity: (SPY or VTI)
Foreign Equity: (EFA or VEU)
Emerging Market Equity: (EEM or VWO)
REITs: (IYR or VNQ or ICF)
Fixed Income: (AGG or BND)
Performance chart (as of Dec 2, 2010)Performance table (as of Dec 2, 2010)
Portfolio Name 1Yr AR 1Yr Sharpe 3Yr AR 3Yr Sharpe 5Yr AR 5Yr Sharpe Peabody Investments Corp.Employee Retirement Account Tactical Asset Allocation Moderate 13% 103% 8% 75% 13% 102% Peabody Investments Corp.Employee Retirement Account Strategic Asset Allocation Moderate 13% 141% 3% 18% 7% 41% Five Core Asset Index ETF Funds Tactical Asset Allocation Moderate 9% 59% 7% 57% 14% 94% Five Core Asset Index ETF Funds Strategic Asset Allocation Moderate 12% 95% 4% 14% 8% 35% Currently, asset classes in US Equity (SPY,VTI), Emerging Market Equity (EEM,VWO) and Fixed Income (AGG,BND) are doing relatively well. These asset classes are available to Peabody Investments Corp.Employee Retirement Account participants.
To summarize, Peabody Investments Corp.Employee Retirement Account plan participants can achieve reasonable investment returns by adopting asset allocation strategies that are tailored to their risk profiles.
Symbols: BTU , SPY , VTI , EFA , VEU , EEM , VWO , IYR , VNQ , ICF , AGG , BND , HYG , JNK , PHB , CIU , BIV , GWL , PFA , IVE , IWW , JKF , VTV , ELV , PWV , RPV , SCHV , EFV , PID , DWM , TZD , TZE , TZG , TZI , TZO , TZL , TZV , IVV , IYY , IWV , VV , DLN , RSP , SCHX , TLT , TLH , IEF , EDV , VGLT , TLO , PLW , IVW , IWZ , JKE , VUG , ELG , QQQQ , RPG , SCHG , IJH , IWR , JKG , VO , MDY , EMM , PJG , DON , EZM , MVV , IJR , IWM , JKJ , VB , DSC , PJM , DES , SAA , UWM , SCHA , GMM , PXH , DEM , SCHE , CLY , LQD , BLV , VCLT , IEI , VGIT , ITE , IJK , IWP , VOT , EMG , PWJ , RFG , UKW , IJT , IWO , JKK , VBK , DSG , PWT , RZG , UKK
- Capital Accumulation Plan of The Chubb Corporation Report On 12/03/2010
12/03/2010
- EQT CORPORATION SAVINGS AND PROTECTION PLAN Report On 12/03/2010
12/03/2010
- Vanguard Variable Annuity Report On 12/06/2010
12/06/2010
- TD Ameritrade Commission Free ETFs Report On 12/07/2010
12/07/2010
- Vanguard-VA-Clone Report On 12/07/2010
12/07/2010
- Sprint Nextel 401K Plan Report On 03/21/2011
03/21/2011