 |
Vanguard ETF: |  |
7.4%* |
|
Diversified Core: | |
8.1%* |
|
Six Core Asset ETFs: | |
7.3%* |
Articles on VUG
- Bernstein's No Brainer and Smart Money Portfolios Reviewed
10/08/2010
Dr. William Bernstein is the author of the "Intelligent Asset Allocator" and "The Four Pillars of Investing." He's also a physician, neurologist and financial adviser to high-net-worth individuals.
He has proposed a number of lazy portfolios. There are two that will be examined today.The no-brainer portfolio comprises the following fund allocation- 25% in Vanguard 500 Index VFINX (IVW)
- 25% in Vanguard Small Cap NAESX or VTMSX (VB)
- 25% in Vanguard Total International VGTSX or VTMGX (EFA, VEA)
- 25% in Vanguard Total Bond VBMFX or VBISX (BND)
Things to note about the portfolio:- Heavily weighted towards domestic equities
- Similar to a three asset SIB with domestic, international and fixed income
- It would be better to have some REIT or emerging markets exposure
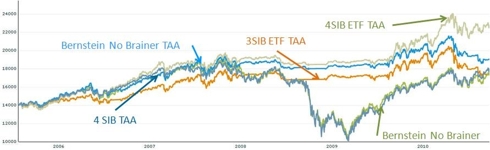
- We will compare the no brainer portfolio to a three and four asset SIB
Annual returns 1 year 3 years 5 years Bernstein No Brainer 10 -1 4 Bernstein Tactical Asset Allocation -3 0 6 Four SIB Strategic Asset Allocation 14 -1 5 Three SIB Strategic Asset Allocation 8 -4 4 Three SIB Tactical Asset Allocation -5 0 6 The Bernstein no-brainer tracks very closely with the four asset SIB. It’s interesting to note that the three asset Bernstein tracks closer to the four asset SIB than expected. So as a lazy portfolio, it performs satisfactorily. Year to date, however, the four asset SIB has better performance.
The tactical asset allocation strategies deliver better results with higher returns and lower volatility. The no brainer funds outperform the 3 asset SIB but underperform the 4 asset SIB which is to be expected.
The smart money portfolio comprises the following fund allocation- 40% Vanguard Short Term Investment Grade VFSTX (SCJ, SHY)
- 15% Vanguard Total Stock Market VTSMX (VTI)
- 10% Vanguard Small Cap Value VISVX (VBR)
- 10% Vanguard Value Index VIVAX (VTV)
- 5% Vanguard Emerging Markets Stock VEIEX (VWO)
- 5% Vanguard European Stock VEURX (VEU)
- 5% Vanguard Pacific Stock VPACX (VPL)
- 5% Vanguard REIT Index VGSIX (RWX, VNQ)
- 5% Vanguard Small Cap Value NAESX or VTMSX (VB)
To summarize:- 40% in US equities
- 10% in international equities
- 5% in emerging market equities
- 5% in REIT
- 40% in fixed income
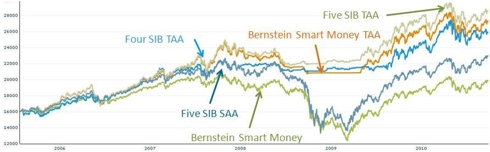
Annual returns 1 year 3 years 5 years Smart Money 10 -1 4 Smart Money Tactical Asset Allocation -3 0 6 Five SIB Strategic Asset Allocation 14 -1 5 Five SIB Tactical Asset Allocation 8 -4 4 Four SIB Tactical Asset Allocation -5 0 6 Although the smart money portfolio has five asset classes, international, emerging markets and real estate are so under-weighted that they act as if they are a single class so, again, it’s more like a three asset class portfolio. The five asset SIB with strategic asset allocation has similar behavioral properties but clearly delivers better results based on superior diversification.
One the strategy is moved over to tactical asset allocation, there are enough asset classes in the Bernstein portfolio for the Larger Chartresults to be clearly superior than a four asset SIB and close to the five asset SIBWe look at the two portfolios as a final comparison
Annual returns 1 year 3 years 5 years Bernstein No Brainer 10 -1 4 Bernstein Smart Money 10 -1 4 They are remarkably close to each other full comparison
Takeaways- Tactical Asset Allocation reduces downside risk and that wins in the current uncertain environment
- Both Bernstein portfolios perform satisfactorily for a lazy portfolio – it is surprising that the no-brainer performs so well against it’s more diversified smart-money cousin
- ETF’s can readily be used to implement these portfolios with good performance
labels:investment,
Symbols:BND,BWX,CIU,CSJ,DBC,DVY,EFA,EFG,EFV,EMB,GLD,HYG,IEF,IEI,IJJ,IJK,LQD,MBB,QQQQ,RWX,SCZ,SHY,TIP,VB,VBK,VBR,VEA,VNQ,VO,VTI,VTV,VUG,VWO,WIP,Portfolio-Building,with,ETFs,Closed-End,Funds,Commodity,ETFs,Currency,ETFs,Developed,Market,ETFs,
- Diversification, Style AND Asset Rotation Improve Portfolio Performance without Incurring Extra Risk
10/08/2010
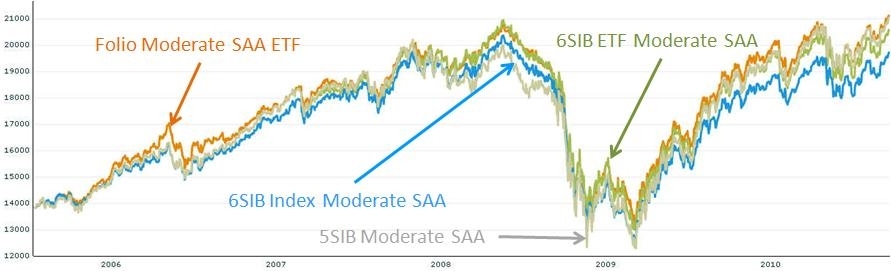
In a previous article we compared the results of a highly diversified ETF portfolio with strategic asset allocation that permitted style rotation against strategic asset allocation without style rotation. We did this by restricting the other portfolios to one fund per asset class. We saw that style rotation squeezes out a little more in return for more trading. Putting this together with a “one-click” execution capability that Folio Investing offers offsets some of the effort.
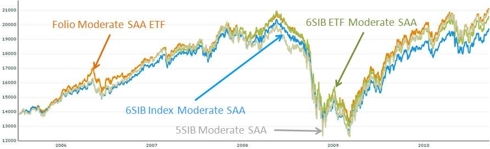
Annual returns 1 year 3 years 5 years Folio SAA Moderate 12.43 3.26 8.15 6 SIB ETF SAA Moderate 11.53 2.51 7.89 6 SIB Index SAA Moderate 10.63 1.66 6.72 5 SIB Index SAA Moderate 12.44 2.16 7.00
In this article, we are going to step up to the next level and take the same portfolio and deploy strategic asset allocation – allowing the portfolio to flow with asset momentum and review what additional risk adjusted returns are delivered.
Strategic Asset Allocation will move funds in asset classes but each asset class will always have the same weighting in the overall portfolio.
Tactical Asset Allocation takes this one step further, enabling asset classes with poor market momentum to be swapped out for another class. Note that fixed income will never be swapped out but may have an increased percentage of the overall portfolio in turbulent times. This approach seeks to limit the downside while participating in the upside.
Intuitively we would expect higher returns offset against more trading activity.We are going to compare the Folio SAA moderate that delivered the best performance in the SAA category with a tactical asset allocation of the same portfolio and a 6 Asset SIB with both ETF’s and Index funds. This will enable us to compare- Tactical versus strategic asset allocation
- The benefit of multiple ETF’s per class versus a single ETF per class
- How ETF’s compare against market indices.
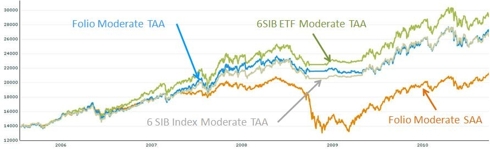
A snapshot of the results graph is shown above with summary data in the table below.
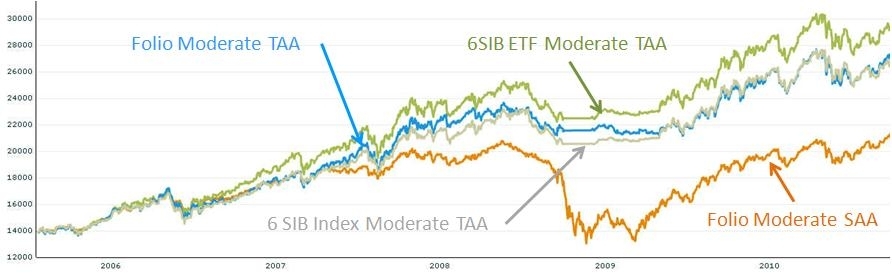
Returns Table of the Different Portfolios
Annual returns 1 year 3 years 5 years Folio SAA Moderate 12.43 3.26 8.15 Folio TAA Moderate 11.74 9.24 11.26 6SIBETF TAA Moderate 9.57 9.62 15.68 6SIBIndex TAA Moderate 8.41 9.22 13.43
The first thing to note is that tactical asset allocation performs better by mitigating downside risk. The strategic asset allocation has performed well as we recover from the sharp drops of recent years but with continuing uncertainty, minimizing downside risk. Again, the benefit of having one-click execution relieves much of the mechanical overhead in pursuing a tactical asset allocation strategy.It is also interesting to note that in this simulation, the best performance comes from the six asset class SIB with fewer fund choices than the Folio portfolio. The reason is that the Folio portfolio used more conservative bond choices that limited the downside but also, slightly reduced the upside. This is a tradeoff that each investor has to make as to whether they want to limit the risk at the cost of a little bit of upside.
Finally, both ETF portfolios perform very well against market index funds.Takeaways- Tactical Asset Allocation reduces downside risk and that wins in the current uncertain environment
- ETF’s perform very well against market index funds in both tactical and strategic asset allocation strategies
- Having a simple and low means of executing the trades is an essential part of a hybrid approach to make it easy on the investor
labels:investment,
Symbols:BND,BWX,CIU,CSJ,DBC,DVY,EFA,EFG,EFV,EMB,GLD,HYG,IEF,IEI,IJJ,IJK,LQD,MBB,QQQQ,RWX,SCZ,SHY,TIP,VB,VBK,VBR,VEA,VNQ,VO,VTI,VTV,VUG,VWO,WIP,Portfolio-Building,with,ETFs,Closed-End,Funds,Commodity,ETFs,Currency,ETFs,Developed,Market,ETFs,
- Google’s 401K Plan: Another Good Employee Benefit
09/26/2010
In our previous article, we discussed Hewlett Packard 401K plan. This article continues the series of case studies for various 401K plans for IT companies. It discusses Google 401K Plan and how portfolios in this plan are positioned in today’s market environment.
Google (NASDAQ: GOOG) is an internet search and advertising company that pioneered in search technology. It dominates search and its related advertising business. It is headquartered in the old SGI building in Mountain View, California. Google is well known for its talented employees and innovation friendly work environment. Google offers generous 401K match to its employees.
Google 401K plan consists of 15 funds. These funds enable participants to gain exposure to 4 major assets: US Equity, Foreign Equity, REITs and Fixed Income. The list of minor asset classes covered are
Large Blend: SPY, VTI
Mid-Cap Blend: MDY, IWR
Foreign Large Blend: EFA
Foreign Large Growth: EFG
Real Estate: IYR, ICF, VNQ
Intermediate-Term Bond: AGG, BND
Short Bond: BSVAs of 9/15/2010, this plan investment choice is rated as Above Average based on MyPlanIQ Plan Rating methodology that was designed to measure how effective a plan's available investment funds are. It has the following detailed ratings:
Diversification – Rated as average (score: 62%)
Fund Quality – Rated as above average (score: 65%)
Portfolio Building -- Rated as great (score: 92%)
Overall Rating: above average (score: 75%)
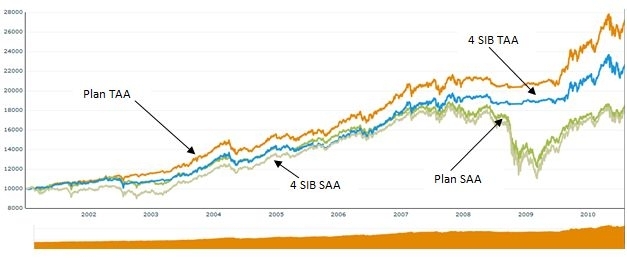
The chart and table below show the historical performance of moderate model portfolios employing strategic and tactical asset allocation strategies (SAA and TAA, both provided by MyPlanIQ). For comparison purpose, we also include the moderate model portfolios of a typical four asset SIB (Simpler Is Better) plan. This SIB plan has the following candidate index funds and their ETFs equivalent:
US Equity (SPY or VTI)
Foreign Equity (EFA or VEU)
REITs (IYR or VNQ or ICF)
Fixed Income (AGG or BND)
Performance chart (as of 9/15/2010)
Performance table (as of 9/15/2010)
1 Yr AR (%) 1 Yr Sharpe (%) 3 Yr AR (%) 3 Yr Sharpe(%) 5 Yr AR (%) 5 YR Sharpe (%) Plan SAA 9 83 1 4 4 18 4 SIB SAA 10 72 1 3 5 17 Plan TAA 14 93 11 97 11 101 4 SIB TAA 9 59 7 61 9 80 Currently, asset classes in REITs (Real Estate Investment Trusts) (VNQ, IYR, ICF) and fixed income (AGG, BND) are doing relatively well. These asset classes are available to Google 401k plan participants.
To summarize, Google 401K plan participants can achieve reasonable investment returns by adopting asset allocation strategies that are tailored to their risk profiles. Currently, the tactical asset allocation strategy indicates overweighing on REITs and fixed income funds.
labels:investment,
Symbols:GOOG,HPQ,SPY,VTI,IWD,VTV,IWF,VUG,MDY,IWR,EFA,EFG,EFV,SCZ,IYR,ICF,VNQ,BWX,PCY,EMB,BND,IEF,TLT,BSV,MUB,HYG,JNK,PHB,VEU,ETF,Portfolio,Building,Asset,Allocation,IRA,401K,
- Armstrong Index Based Lazy Portfolio Returns Study
09/17/2010
Frank Armstrong, author of The Informed Investor, proposed thisportfolio for an MSN Money article. The two key points of the portfolio are that it has four asset classes (US, International, REIT, Bonds) and relies on market indices rather than active management.The portfolio uses index funds because index funds eliminate manager risk. It overweights small-cap stocks as small-cap stocks have historically outperformed large caps stocks. The portfolio has a strong value tilt, based on the theory that, over the long haul, beaten-down stocks will perform better than high-flying growth stocks.
This should be a low cost, well performing portfolio.The fund selection for testing the strategy is listed below with the ETF alternatives:- 9.25% in Vanguard Small Cap Value VISVX (SCZ)
- 9.25% in Vanguard Value VIVAX (SPY, IYY)
- 6.25% in Vanguard Small-Cap Growth VISGX (VBK)
- 6.25% in Vanguard 500 Index VFINX (IVW)
- 31% in Vanguard Total International Stock VGTSX (EFA)
- 8% in Vanguard REIT VGSIX (IYR, VNQ, RWX)
- 30% in Vanguard Short-Term Bond VBISX (BND, AGG)
Things to note about the portfolio:- This is designed as a lazy portfolio with limited rebalancing specified
- With 70% in equities, this would be considered an aggressive portfolio
- REIT is possibly underweighted
We will create historical returns of this portfolio as originally planned and then compare against strategic asset allocation (annual rebalance) and tactical asset allocation. This will measure:- The impact of equal weighting of the equities – bonds will be fixed at 30% -- SAA strategy
- The impact of actively managing the equities – bonds remain fixed at 30% -- TAA strategy
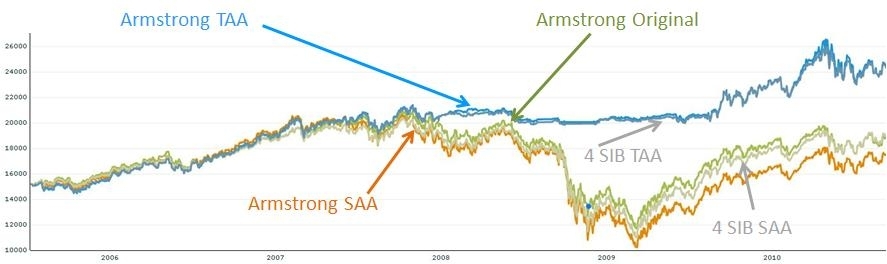
We will then introduce a four asset SIB which will give a measure of the choice of funds. The SAA and TAA strategies will give the same weights to each of the funds but use simpler asset classes funds.4 Asset SIB Breakdown with ETF alternativesLARGE BLEND VTSMX (VTI)Foreign Large Blend VGTSX (VEU)REAL ESTATE VGSIX (VNQ)Intermediate-Term Bond VBMFX (BND)The results are shown below. There are a number of interesting things to note- The closest comparison of similar strategies is the Armstrong Original versus the Armstrong SAA. The Armstrong original outperforms SAA which says that overloading the US stocks towards small value is successful
- All of the buy and hold strategies suffer from the “downturn dip” and the tactical asset allocation strategies perform much better
- The difference between the two TAA strategies is negligible
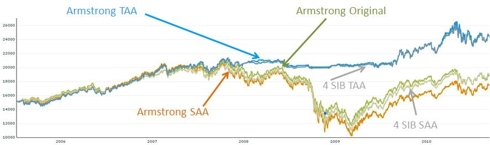
Annual Returns 1 Year 3 Years 5 Years Original 8.83 -0.88 4.27 Armstrong SAA 13.91 -2.60 2.96 Armstrong TAA 12.71 7.30 10.43 4 SIB SAA 14.12 0.25 4.59 4 SIB TAA 12.32 7.15 10.21
Takeaways:- The Armstrong portfolio is a well constructed set of diversified assets based on market indices
- To reduce volatility in today’s economy, it might make sense to add commodities and emerging market equities
- The biggest impact on returns is moving to a tactical asset allocation strategy
- The SIB portfolios which can easily be executed with ETF’s perform very well and will be low cost
labels:investment,
Symbols:DIA,IYY,VTI,DVY,ONEQ,QCLN,QABA,PWC,VTV,VUG,IWM,IWO,IWW,MDY,IJJ,IJK,VO,AGG,BND,SHY,VBK,IJS,VBR,IWP,IWS,VEA,EFG,EFV,VWO,VEU,SCZ,SPY,IYR,IVW,RWX,EFA,VNQ,Tactical,Asset,Allocation,asset,allocation,armstong,ideal,index,strategic,asset,allocation,
- Getting Most out of Your Retirement Plan: A Case Study on Hewlett Packard 401K Plan
09/16/2010
Retirement investing is an integral part of American personal finance. With $8.9 trillion parked in over 800 thousand retirement plans (401K), millions of Americans will increasingly rely on their 401K accounts to fund their future retirement needs. This article is part of a series of case studies we are conducting for various 401K plans. In this article, we will discuss how participants in Hewlett Packard 401K plan can achieve reasonable investment results using asset allocation strategies. We will also discuss how those portfolios are positioned in today’s market environment.
Hewlett Packard (HP) (NYSE: HPQ) is one of the largest IT companies. Founded by Bill Hewlett and Dave Packard in Palo Alto, California, HP was the earliest technology company that eventually led the formation of Silicon Valley. Today Hewlett-Packard has over 300 thousands employees world wide.
HP is known to be employee friendly. It has been named several times as one of the best companies to work for. Its 401k plan provides a well diversified array of high quality funds.
Hewlett Packard 401K plan consists of 29 funds. These funds enable participants to gain exposure to 5 major assets: US Equity, Foreign Equity, Emerging Market Equity, REITs and Fixed Income. The the list of minor asset classes covered:
Large Blend: SPY, VTI
Large Value: IWD, VTV
Large Growth: IWF, VUG
Mid-Cap Blend: MDY, IWR
Foreign Large Blend: EFA
Foreign Large Growth: EFG
Foreign Large Value: EFV
Foreign Small/Mid Growth: SCZ
Diversified Emerging Mkts: EEM, VWO
Real Estate: IYR, ICF, VNQ
World Bond: BWX
Emerging Markets Bond: PCY, EMB
Inflation-Protected Bond: TIP
Intermediate-Term Bond: AGG, BND
Long Government: IEF, TLT
UltraShort Bond: BSV
Muni National Long: MUB
High Yield Bond: HYG, JNKAs of 9/13/2010, this plan investment choice is rated as Above Average based on MyPlanIQ Plan Rating methodology that was designed to measure how effective a plan's available investment funds are. It has the following detailed ratings:
Diversification – Rated as great (score: 89%)
Fund Quality – Rated as above average (score: 76%)
Portfolio Building -- Rated as above average (score: 72%)
Overall Rating: above average (score: 78%)
The chart and table below show the historical performance of moderate model portfolios employing strategic and tactical asset allocation strategies (SAA and TAA, both provided by MyPlanIQ). For comparison purpose, we also include the moderate model portfolios of a typical five asset SIB (Simpler Is Better) plan. This SIB plan has the following candidate index funds and their ETFs equivalent:
US Equity (SPY or VTI)
Foreign Equity (EFA or VEU)
Emerging Market Equity (EEM or VWO)
REITs (IYR or VNQ or ICF)
Fixed Income (AGG or BND)
Performance chart (as of 9/13/2010)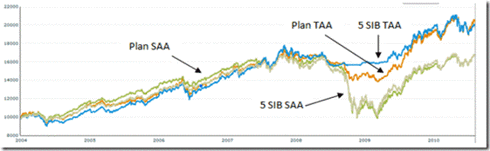
Performance table (as of 9/13/2010)
1 Yr AR (%) 1 Yr Sharpe (%) 3 Yr AR (%) 3 Yr Sharpe(%) 5 Yr AR (%) 5 YR Sharpe (%) Plan SAA 15.95 145.83 2.34 10.27 5.76 29.43 5 SIB SAA 13.09 96.52 2.49 8.77 6.74 29.02 Plan TAA 15.53 103.28 9.35 73.75 11.43 88.56 5 SIB TAA 9.99 68.82 8.11 66.77 11.62 92.08 Currently, asset classes in emerging market stocks (EEM, VWO), REITs (Real Estate Investment Trusts) (VNQ, IYR, ICF) and fixed income (AGG, BND) are doing relatively well. These asset classes are available to HP 401k participants.
To summarize, Hewlett Packard 401K plan participants can achieve reasonable investment returns by adopting asset allocation strategies that are tailored to their risk profiles. Currently, the tactical asset allocation strategy indicates overweighing on emerging market stocks, REITs and fixed income funds.
labels:investment,
Symbols:HPQ,SPY,VTI,IWD,VTV,IWF,VUG,MDY,IWR,EFA,EFG,EFV,SCZ,IYR,ICF,VNQ,BWX,PCY,EMB,BND,IEF,TLT,BSV,MUB,HYG,JNK,PHB,VEU,ETF,Portfolio,Building,Asset,Allocation,IRA,401K,
- How Does Your Garden Grow?
09/16/2010
- Schwab ETFs Review
07/27/2010


- Aflac Incorporated 401(k) Savings and Profit Sharing Plan Report On 12/03/2010
12/03/2010
This report reviews Aflac Incorporated 401(k) Savings and Profit Sharing Plan plan. We will discuss the investment choices and present the plan rating by MyPlanIQ. Current economic and market conditions are discussed in the context of the investment portfolios in the plan. We will then show how participants in Aflac Incorporated 401(k) Savings and Profit Sharing Plan can achieve reasonable investment results using asset allocation strategies.
Plan Review and Rating
AFLAC Inc (Ticker:AFL) has the "Aflac Incorporated 401(k) Savings and Profit Sharing Plan".
Aflac Incorporated 401(k) Savings and Profit Sharing Plan's 401K plan consists of 11 funds. These funds enable participants to gain exposure to 3 major assets: US Equity, Foreign Equity, Fixed Income. The list of minor asset classes covered:
Foreign Large Blend: EFA, VEU, GWL, PFA
Intermediate-term Bond: AGG, CIU, BIV, BND
Large Blend: IVV, IYY, IWV, VTI, VV, SPY, DLN, RSP, SCHX
Large Growth: IVW, IWZ, JKE, VUG, ELG, QQQQ, RPG, SCHG
Large Value: IVE, IWW, JKF, VTV, ELV, PWV, RPV, SCHV
Mid-cap Growth: IJK, IWP, VOT, EMG, PWJ, RFG, UKW
Moderate Allocation: AOM
Small Growth: IJT, IWO, JKK, VBK, DSG, PWT, RZG, UKK
As of Dec 2, 2010, this plan investment choice is rated as based on MyPlanIQ Plan Rating methodology that measures the effectiveness of a plan's available investment funds. It has the following detailed ratings:
Diversification -- Rated as (35%)
Fund Quality -- Rated as (33%)
Portfolio Building -- Rated as (36%)
Overall Rating: (35%)Current Economic and Market Conditions
We have experienced an uncertain 2010: plenty of worries on whether the US economy will climb out of the great recession and recover.
- The Federal Reserve embarked on Quantitative Easing II (QE2) to stimulate the economy.
- The housing market is still at its low but largely stabilized.
- The unemployment rate is stuck at 9%.
Americans continue to face an uncertain future, given (among others) the high unemployment rate, large federal and local government debts and global trade imbalance. With such an economic backdrop, the stock and debt markets are going to be volatile. Despite this, markets have been resilient and appear positioned to rebound.
In this market it is even more critical to properly diversify and respond market changes. MyPlanIQ offers two asset allocation strategies: strategic and tactical asset allocation strategies ( SAA and TAA for participants in Aflac Incorporated 401(k) Savings and Profit Sharing Plan).
Strategic Asset Allocation is based on well known modern portfolio theory and its key features include: diversification, proper fund selection and periodically re-balancing.
Tactical Asset Allocation works on a diversified array of assets provided by funds in a plan and adjusts asset mixes based on market conditions such as asset price momentum utilized by TAA.
Portfolio Discussions
The chart and table below show the historical performance of moderate model portfolios employing strategic and tactical asset allocation strategies. For comparison purpose, we also include the moderate model portfolios of a typical 3 asset SIB (Simpler Is Better) plan . This SIB plan has the following candidate index funds and their ETFs equivalent:
US Equity: (SPY or VTI)
Foreign Equity: (EFA or VEU)
Fixed Income: (AGG or BND)
Performance chart (as of Dec 2, 2010)Performance table (as of Dec 2, 2010)
Portfolio Name 1Yr AR 1Yr Sharpe 3Yr AR 3Yr Sharpe 5Yr AR 5Yr Sharpe Aflac Incorporated 401(k) Savings and Profit Sharing Plan Tactical Asset Allocation Moderate 4% 34% 5% 64% 8% 81% Aflac Incorporated 401(k) Savings and Profit Sharing Plan Strategic Asset Allocation Moderate 10% 100% 2% 8% 6% 31% Three Core Asset ETF Index Funds Tactical Asset Allocation Moderate -4% -35% 1% 9% 4% 27% Three Core Asset ETF Index Funds Strategic Asset Allocation Moderate 9% 60% -0% -3% 4% 13% Currently, asset classes in US Equity (SPY,VTI), Foreign Equity (EFA,VEU) and Fixed Income (AGG,BND) are doing relatively well. These asset classes are available to Aflac Incorporated 401(k) Savings and Profit Sharing Plan participants.
To summarize, Aflac Incorporated 401(k) Savings and Profit Sharing Plan plan participants can achieve reasonable investment returns by adopting asset allocation strategies that are tailored to their risk profiles.
Symbols: AFL , SPY , VTI , EFA , VEU , AGG , BND , AOM , CIU , BIV , GWL , PFA , IVE , IWW , JKF , VTV , ELV , PWV , RPV , SCHV , IVV , IYY , IWV , VV , DLN , RSP , SCHX , IVW , IWZ , JKE , VUG , ELG , QQQQ , RPG , SCHG , IJK , IWP , VOT , EMG , PWJ , RFG , UKW , IJT , IWO , JKK , VBK , DSG , PWT , RZG , UKK
- ALLERGAN, INC. SAVINGS AND INVESTMENT PLAN Report On 12/03/2010
12/03/2010
- Apartment Investment and Management Company 401(k) Retirement Plan Report On 12/03/2010
12/03/2010
- ASSURANT 401(k) PLAN A&PLAN B Report On 12/03/2010
12/03/2010
- Abercrombie Fitch Co. Savings and Retirement Plan Report On 12/03/2010
12/03/2010
- Apache Design Solutions 401K Report On 12/03/2010
12/03/2010
- Allegheny Ludlum Corporation Personal Retirement and 401(k) Savings Account Plan Report On 12/03/2010
12/03/2010
- ALLEGHENY ENERGY EMPLOYEE STOCK OWNERSHIP AND SAVINGS PLAN Report On 12/03/2010
12/03/2010
- BAKER 401(k) PLAN Report On 12/03/2010
12/03/2010
- BRISTOL-MYERS SQUIBB COMPANY SAVINGS AND INVESTMENT PROGRAM Report On 12/03/2010
12/03/2010
- PEABODY WESTERN-UMWA 401(K) PLAN Report On 12/03/2010
12/03/2010
- Peabody Investments Corp.Employee Retirement Account Report On 12/03/2010
12/03/2010
- Capital Accumulation Plan of The Chubb Corporation Report On 12/03/2010
12/03/2010
- CEPHALON, INC. 401(k) PROFIT SHARING PLAN Report On 12/03/2010
12/03/2010
- CABOT OIL & GAS CORPORATION SAVINGS INVESTMENT PLAN Report On 12/03/2010
12/03/2010
- Danaher Corporation Subsidiaries Retirement and Savings Plan Report On 12/03/2010
12/03/2010
- Danaher Corporation Subsidiaries Savings Plan Report On 12/03/2010
12/03/2010
- EQT CORPORATION SAVINGS AND PROTECTION PLAN Report On 12/03/2010
12/03/2010
- Vanguard Variable Annuity Report On 12/06/2010
12/06/2010
- The Franklin Templeton NJBEST New Jersey 529 College Savings Plan Report On 12/07/2010
12/07/2010
- TD Ameritrade Commission Free ETFs Report On 12/07/2010
12/07/2010
- Qualcomm 401(k) Plan Report On 12/07/2010
12/07/2010
- Vanguard-VA-Clone Report On 12/07/2010
12/07/2010
- Tiffany Co. Employee Profit Sharing and Retirement Savings Plan Report On 03/21/2011
03/21/2011
- Sprint Nextel 401K Plan Report On 03/21/2011
03/21/2011