 |
Vanguard ETF: |  |
7.4%* |
|
Diversified Core: | |
8.1%* |
|
Six Core Asset ETFs: | |
7.3%* |
Articles on IWV
- How Plan Rating Stack up Against ETF Portfolios Returns -- Part 3
11/03/2010
Plan rating is a quick and easy way to get a read on a plan and what a portfolio built from the funds in the plan can deliver. This is not the whole story but is a rapid means of making an assessment.
In this article we are comparing two sets of plans to expose what plan rating gives you and contrast it with backtested results.
1. News Corp Versus New York Times have been separately reviewed and the purpose here is to compare their plan profile and compare the plan ranking.
As of Oct 26, 2010 News Corp's plan and ratings summary is:Asset Class News Corp Funds New York Times Funds U.S. Equity Excluding Company Stock 3 6 International Equity 2 2 Emerging Markets 0 1 Fixed Income Including Money Market 2 2 Target Date Funds 0 11 Plan Rating Attribute News Corp New York Times Diversification 4% 64% Fund Quality 49% 90% Portfolio Building 65% 31% Overall Rating 42% 59% Performance table (as of Oct 29, 2010)
Portfolio Name 1Yr AR 1Yr Sharpe 3Yr AR 3Yr Sharpe 5Yr AR 5Yr Sharpe News America (News Corp) 401k Savings Plan Tactical Asset Allocation Moderate 8% 67% 6% 62% 10% 92% News America (News Corp) 401k Savings Plan Strategic Asset Allocation Moderate 11% 130% 3% 18% 7% 44% THE NEW YORK TIMES COMPANIES SUPPLEMENTAL RETIREMENT AND INVESTMENT PLAN Tactical Asset Allocation Moderate 10% 85% 7% 62% 13% 114% THE NEW YORK TIMES COMPANIES SUPPLEMENTAL RETIREMENT AND INVESTMENT PLAN Strategic Asset Allocation Moderate 14% 135% 1% 2% 7% 44% Currently, asset classes in US Equity ( SPY , VTI ) , Foreign Equity ( EFA , VEU ) and Fixed Income ( AGG , BND ) are doing relatively well. These asset
2. TD Ameritrade Versus Vanguard ETFs have been separately reviewed and the purpose here is to compare their plan profile and compare the plan ranking.Asset Class TDA Funds Vanguard Funds U.S. Equity Excluding Company Stock 31 33 International Equity 14 6 Emerging Markets 11 1 Real Estate 4 1 Commodities 6 1 Sectors 3 9 Fixed Income Including Money Market 32 11 Plan Attribute TDA Vanguard Diversification 95% 57% Fund Quality 26% 56% Portfolio Building 92% 51% Overall Rating 73% 54% Performance chart (as of Oct 25, 2010):
Performance table (as of Oct 25, 2010):Portfolio Name 1Yr AR 1Yr Sharpe 3Yr AR 3Yr Sharpe 5Yr AR 5Yr Sharpe Vanguard 62 Tactical Asset Allocation Moderate 14% 93% 5% 33% 13% 81% Vanguard 62 Strategic Asset Allocation Moderate 17% 126% 2% 5% 8% 42% TD Ameritrade Commission Free ETFs Tactical Asset Allocation Moderate 14% 96% 13% 84% 20% 128% TD Ameritrade Commission Free ETFs Strategic Asset Allocation Moderate 10% 89% -1% -10% 8% 44%
If we now compare ratings and five year performance we get the following graph: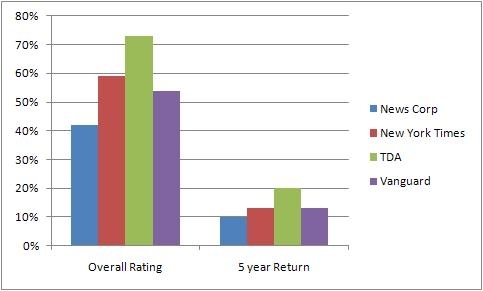
If we now normalize both sides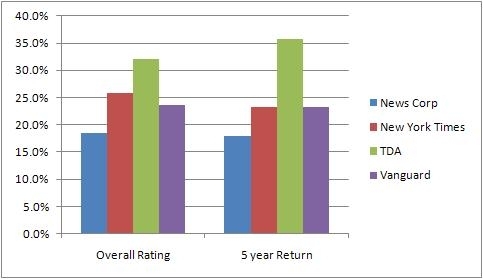
We can see that there is reasonable correlation between the plan rating and the five year return number.
Note that this is not an exact science and there are many exceptions. In addition, this is not the whole story, just a means of assessing a plan and uncovering where there may be weaknesses in the long term.
MyPlanIQ continues to improve the plan rating which is accessible to anybody at no cost.labels:investment,
Symbols:SPY,VTI,EFA,VEU,EEM,VWO,AGG,BND,AOM,CIU,BIV,GWL,PFA,EFV,PID,DWM,TZD,TZE,TZG,TZI,TZO,TZL,TZV,IVV,IYY,IWV,VV,DLN,RSP,SCHX,IVW,IWZ,JKE,VUG,ELG,QQQQ,RPG,SCHG,IJR,IWM,JKJ,VB,DSC,PJM,DES,SAA,UWM,SCHA,GMM,PXH,DEM,SCHE,
- How Plan Rating Stack up Against ETF Portfolios Returns -- Part 2
11/02/2010
We are going to use our SIBs to explore plan rating so that it is clear how it works.
We will use a six asset SIB that has Vanguard market funds and a six asset SIB that has Vanguard ETF's. Both have one fund per asset class.Asset Class Index SIB ETF SIB U.S. Equity Excluding Company Stock VTSMX VTI International Equity VGTSX VEU Emerging Markets VEIEX VWO Real Estate VGSIX VNQ Commodities DBC DBC Fixed Income Including Money Market VBMFX BND The current ratings given to each SIB are listed below.
Plan Rating Attribute Index SIB ETF SIB Diversification 60% 60% Fund Quality 74% 39% Portfolio Building 85% 81% Overall Rating 74% 62%
We base the Diversification score on nine asset classes: US Equity, International Equity, Fixed Income, Real Estate, Commodities, Emerging Markets, International Bonds, High Yield Bonds, Balanced Funds. For each asset class, except for US Equity, the diversification score is highest to plans having 4-5 funds in each asset class as this allows the investor to find and use the best funds. For an application like MyPlanIQ, the more funds the better because it can search efficiently through a large number of alternatives but that is not true in the general case. The US is treated as a special case where the sweetspot is 7-8 funds as there are more classes and more opportunities for non-correlated benefits. Each of these asset classes are combined to give the overall diversification score.
Both SIBs score identically as they each have one fund in each asset class.We base Fund Quality score on 1Yr, 3Yr, 5Yr and Inception risk adjusted returns. We make a tradeoff between the recent and more distant past. As this is primarily for longer term investments we think that the three and five year returns are the most important and so have the highest weight.
The ETF SIB scores considerably lower than the index funds and that is because many of them don't have a long history and so their historical component is zero. Whereas this is unlikely to returns performance, it is important to recognize that funds with a longer history and give them a measure of preference.
We base the Portfolio Building score on how the funds can combine to give a robust portfolio with different classes and styles being able to interact to provide consistently good results in differing conditions. To achieve this, we use our own strategic asset allocation and tactical asset allocation strategies and perform a number of different simulations.
Both SIBs score approximately the same. There are some differences in the individual behaviors of the funds that make a slight difference but not enough to be significant.
Each one of these categories is then combined to create an overall score.
Now let's see how the rating stacks up against historical returns.
Performance chart (as of Oct 29, 2010)Performance table (as of Oct 29, 2010)
Portfolio Name 1Yr AR 1Yr Sharpe 3Yr AR 3Yr Sharpe 5Yr AR 5Yr Sharpe Six Core Asset ETFs Tactical Asset Allocation Moderate 13% 87% 8% 57% 17% 114% Six Core Asset ETFs Strategic Asset Allocation Moderate 14% 104% 2% 6% 9% 42% Six Core Asset Index Funds Tactical Asset Allocation Moderate 11% 84% 8% 65% 15% 117% Six Core Asset Index Funds Strategic Asset Allocation Moderate 13% 113% 1% 2% 8% 40%
As predicted, the index SIB performance is higher. If we compare the ratio of the TAA performance of the two SIB and the ratio of the performance of the Plan rating of the two SIBs we can see that the ratio of the rating and the 5 year returns follow a similar pattern -- more of this in the final article on this.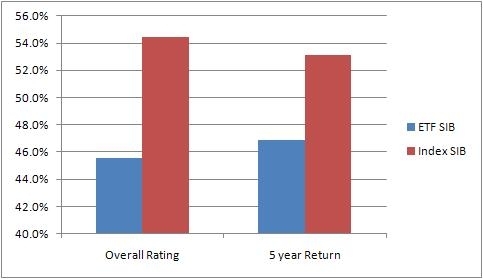
We see that the 5 year returns of the ETF SIB is higher that it's overall rating would initially predict but that is to be expected as we know that the fund quality was impacted by its history which won't, in fact, impact the returns for the period of time it was available.
labels:investment,Symbols:SPY,VTI,EFA,VEU,EEM,VWO,IYR,VNQ,ICF,AGG,BND,DBC,CIU,BIV,GWL,PFA,IVV,IYY,IWV,VV,DLN,RSP,SCHX,GMM,PXH,DEM,SCHE,GSG,
- New York Times -- How Plan Rating Stack up Against ETF Portfolios -- Part 1
11/02/2010
This is the first of three articles where we are going to examine how plan rating can be used to give you additional insight into the properties of a plan (collection of funds) and how they may perform going forward.We have previously examined News Corp's 401K plan. We found that while it was lacking in terms of diversity, it performed well within its scope -- beating the 3 Asset SIB with which it was comparable but losing out to the 4 Asset SIB.
We will now look at the New York Times Company's 401K plan and establish it's performance before comparing the two and examining how each of their ratings gives insight as to their performance. All of MyPlanIQ's plans have ratings so this equally applies to any retirement, taxable, VA, 529 or any other sort of plan.
The New York Times Company, a leading media company with 2009 revenues of $2.4 billion, includes The New York Times, the International Herald Tribune, The Boston Globe, 15 other daily newspapers and more than 50 Web sites, including NYTimes.com,Boston.com and About.com. The Company's core purpose is to enhance society by creating, collecting and distributing high-quality news, information and entertainment.
The New York Times 401K plan consists of 23 funds. These funds enable participants to gain exposure to 4 major assets: US Equity, Foreign Equity, Emerging Market Equity, Fixed Income. The list of minor asset classes covered:
Asset Class Ticker Name Intermediate-Term Bond DODIX Dodge & Cox Income Foreign Large Value DODFX Dodge & Cox International Stock SMALL BLEND LRSCX Lord Abbett Small-Cap Value A LARGE GROWTH PNOYX Putnam New Opportunities Y Emerging Markets EMF Templeton Emerging Markets Fund LARGE BLEND VFINX Vanguard 500 Index Investor Moderate Allocation VAARX Vanguard Asset Allocation Adm LARGE GROWTH VHCOX Vanguard Capital Opportunity Foreign Large Blend VWIGX Vanguard International Growth Target Date 2000-2010 VTOVX Vanguard Target Retirement 2005 Target Date 2000-2010 VTENX Vanguard Target Retirement 2010 Target Date 2011-2015 VTXVX Vanguard Target Retirement 2015 Target Date 2016-2020 VTWNX Vanguard Target Retirement 2020 Target Date 2021-2025 VTTVX Vanguard Target Retirement 2025 Target Date 2026-2030 VTHRX Vanguard Target Retirement 2030 Target Date 2031-2035 VTTHX Vanguard Target Retirement 2035 Target Date 2036-2040 VFORX Vanguard Target Retirement 2040 Target Date 2041-2045 VTIVX Vanguard Target Retirement 2045 Target Date 2050+ VFIFX Vanguard Target Retirement 2050 Retirement Income VTINX Vanguard Target Retirement Income LARGE BLEND REASX Russell U.S. Core Equity I CASH CASH Money Market Summary
US Equity 6 funds
International Equity 2 funds
Emerging Markets 1 fund
Fixed income 1 fund
Target date 11 funds
If we exclude the target date funds as they can't be used to build a portfolio as they are a portfolio in and of themselves, there are ten funds, six of which are US based.
As of Oct 29, 2010, this plan investment choice is rated as average based on MyPlanIQ Plan Rating methodology that was designed to measure how effective a plan's available investment funds are . It has the following detailed ratings:Diversification -- Rated as average (64%)
Fund Quality -- Rated as great (90%)
Portfolio Building -- Rated as below average (31%)
Overall Rating: average (59%)
The rating shows the lack of funds to really build a portfolio and that although there are four asset classes, two of them, most notably Fixed income, only have one fund each.The chart and table below show the historical performance of moderate model portfolios employing strategic and tactical asset allocation strategies (SAA and TAA both provided by MyPlanIQ). For comparison purpose, we also include the moderate model portfolios of a typical 4 asset SIB (Simpler Is Better) plan. This SIB plan has the following candidate index funds and their ETFs equivalent:
US Equity SPY or VTI
Foreign Equity EFA or VEU
Emerging Market Equity EEM or VWO
Fixed Income AGG or BNDPerformance chart (as of Oct 29, 2010)
Performance chart (as of Nov 1, 2010)
Performance table (as of Nov 1, 2010)
Portfolio Name 1Yr AR 1Yr Sharpe 3Yr AR 3Yr Sharpe 5Yr AR 5Yr Sharpe THE NEW YORK TIMES COMPANIES SUPPLEMENTAL RETIREMENT AND INVESTMENT PLAN Tactical Asset Allocation Moderate 10% 85% 7% 62% 13% 114% THE NEW YORK TIMES COMPANIES SUPPLEMENTAL RETIREMENT AND INVESTMENT PLAN Strategic Asset Allocation Moderate 14% 135% 1% 2% 7% 44% Four Core Asset ETF Index Funds Emerging Markets Tactical Asset Allocation Moderate 4% 36% 4% 34% 14% 90% Four Core Asset ETF Index Funds Emerging Markets Strategic Asset Allocation Moderate 13% 98% 0% -0% 8% 37% The results are mixed in the sense that the NYT portfolios outperform the SIBs in the one and three year categories but underperform the SIBs in the five year categories. The choice of multiple funds in the US and international equity categories will allow for styles rotation to find higher returns. However, in the other major categories there are only single options and the benefits of low fees and market index performance in the SIBs allow it to deliver higher performance.
To summarize having a four asset class portfolio is good. The number of funds in the plan is misleading as the target date funds don't assist in building a portfolio -- if you are a believer in target date funds then you have lots of choices. To further improve the portfolio, it is important to increase the fixed income choices immediately and then balance out emerging market choices from the US choices.
In the next article we will compare News Corp and New York Times to see how the plan rating numbers give insight to the quality of the overall plan.
labels:investment,Symbols:SPY,VTI,EFA,VEU,EEM,VWO,AGG,BND,AOM,CIU,BIV,GWL,PFA,EFV,PID,DWM,TZD,TZE,TZG,TZI,TZO,TZL,TZV,IVV,IYY,IWV,VV,DLN,RSP,SCHX,IVW,IWZ,JKE,VUG,ELG,QQQQ,RPG,SCHG,IJR,IWM,JKJ,VB,DSC,PJM,DES,SAA,UWM,SCHA,GMM,PXH,DEM,SCHE,
- Kellogg 401K beats a 3 Asset Class ETF portfolio -- Can't beat the 4 asset class ETF portfolio
11/02/2010
Kellogg Company is an internationally recognized brand in the ready-to-eat cereal and convenience foods. Its principal products include cookies, crackers, toaster pastries, cereal bars, fruit snacks, frozen waffles, and veggie foods.
Kellogg Company sells its products in North America, Europe, Latin America, and the Asia Pacific. The company was founded in 1906 and is headquartered in Battle Creek, Michigan.
Its retirement plan is a reflection of the company -- high quality funds but old style diversification. The 401K plan consists of 8 funds (not including cash). These funds give exposure to 3 major assets: US Equity, Foreign Equity, Fixed Income. The list of minor asset classes covered:Asset Class Ticker Name LARGE BLEND SVSPX SSgA S&P 500 Index EQUITY K Kellogg LARGE VALUE VWNAX Vanguard Windsor II Adm LARGE GROWTH PRGFX T. Rowe Price Growth Stock Foreign Large Blend RERFX American Funds EuroPacific Gr R5 Small Growth VEXRX Vanguard Explorer Adm SMALL VALUE DFSVX DFA U.S. Small Cap Value I Intermediate-Term Bond PTTRX PIMCO Total Return Instl In summary
- Six US equity funds -- including the company's own stock
- One international fund
- One fixed income fund
Having fewer US choices and more fixed income and international choices would provide better diversification as would adding real estate or emerging markets.
Investing in the company's own stock may show loyalty but it may be better to leave that to an employee stock purchase plan if they have it.
Comparable ETF's
Equity: VTI, VT
Foreign Large Blend: EFA, VEU, GWL, PFA
Intermediate-term Bond: AGG, CIU, BIV, BND
Large Blend: IVV, IYY, IWV, VTI, VV, SPY, DLN, RSP, SCHX
Large Growth: IVW, IWZ, JKE, VUG, ELG, QQQQ, RPG, SCHG
Large Value: IVE, IWW, JKF, VTV, ELV, PWV, RPV, SCHV
Small Growth: IJT, IWO, JKK, VBK, DSG, PWT, RZG, UKK
Small Value: IJS, IWN, JKL, VBR, DSV, PWY, RZV, UVTAs of Oct 29, 2010, this plan investment choice is rated as average based on MyPlanIQ Plan Rating methodology that was designed to measure how effective a plan's available investment funds are . It has the following detailed ratings:
Diversification -- Rated as below average (13%)
Fund Quality -- Rated as great (99%)
Portfolio Building -- Rated as average (47%)
Overall Rating: average (53%)The chart and table below show the historical performance of moderate model portfolios employing strategic and tactical asset allocation strategies (SAA and TAA, both provided by MyPlanIQ). For comparison purpose, we also include the moderate model portfolios of a typical 3 asset SIB (Simpler Is Better) plan. This SIB plan has the following candidate index funds and their ETFs equivalent:
US Equity :SPY or VTI
Foreign Equity :EFA or VEU
Fixed Income :AGG or BND
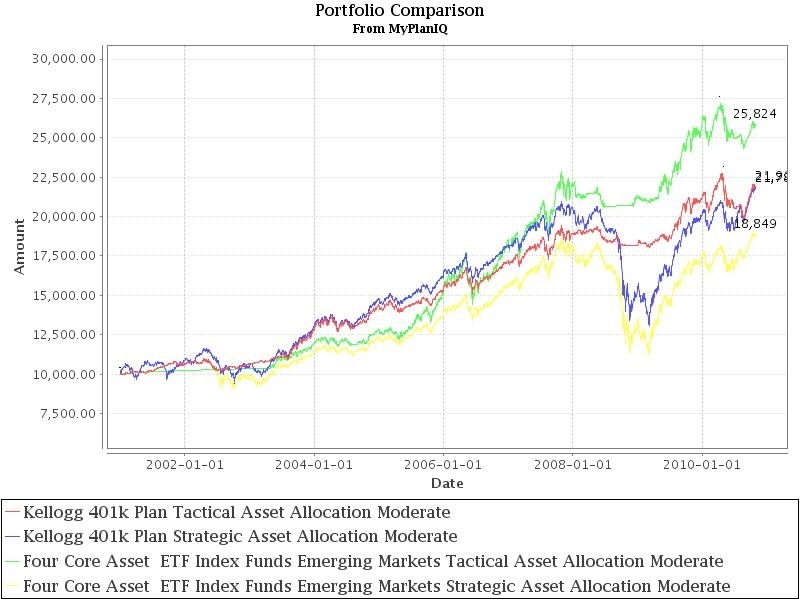
Performance chart (as of Oct 29, 2010)Performance table (as of Oct 29, 2010)
Portfolio Name 1Yr AR 1Yr Sharpe 3Yr AR 3Yr Sharpe 5Yr AR 5Yr Sharpe Kellogg 401k Plan Tactical Asset Allocation Moderate 7% 57% 4% 44% 9% 83% Kellogg 401k Plan Strategic Asset Allocation Moderate 13% 104% 2% 6% 8% 42% Three Core Asset ETF Index Funds Tactical Asset Allocation Moderate 0% 1% 1% 10% 5% 46% Three Core Asset ETF Index Funds Strategic Asset Allocation Moderate 11% 87% -0% -5% 5% 20% The Kellogg 401K plan beats the 3 core asset SIB based on the quality of the funds and the ability to select multiple funds in the US category.
If we now compare it with a four asset ETF SIB it is possible to see the benefit of having the extra asset class even without the benefit of multiple funds in each asset class.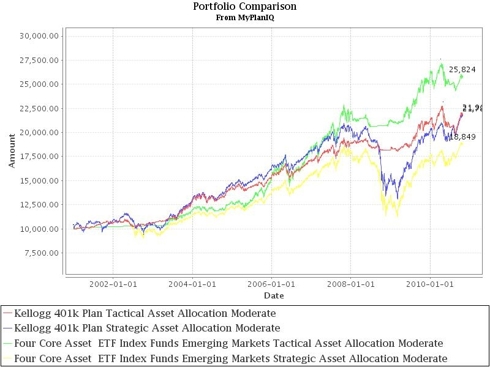
Even with excellent choices of funds, the returns can be beaten by a simple ETF portfolio with an extra asset class.
Kellogg gets strong marks for the choice of funds but are encouraged to add another asset class (or two) to really provide additional returns to their employees.labels:investment,
Symbols:SPY,VTI,EFA,VEU,AGG,BND,VT,CIU,BIV,GWL,PFA,IVE,IWW,JKF,VTV,ELV,PWV,RPV,SCHV,IVV,IYY,IWV,VV,DLN,RSP,SCHX,IVW,IWZ,JKE,VUG,ELG,QQQQ,RPG,SCHG,IJS,IWN,JKL,VBR,DSV,PWY,RZV,UVT,IJT,IWO,JKK,VBK,DSG,PWT,RZG,UKK,
- News Corporation -- Worldwide Presence -- Old Style Retirement
10/28/2010
News Corporation was founded in 1922 and is headquartered in New York, New York. The company operates as a diversified media company worldwide. The company's Filmed Entertainment segment produces and licenses television programming worldwide. Its Television segment develops, produces, and broadcasts television programming in Asia. The company's Cable Network Programming segment produces and licenses programming distributed through cable television systems and direct broadcast satellite operators primarily in the United States. Its Direct Broadcast Satellite Television segment distributes premium programming services via satellite and broadband directly to subscribers in Italy.
Its Newspapers and Information Services segment publishes The Times, The Sunday Times, The Sun, and News of the World national newspapers in the United Kingdom; approximately 146 newspapers in Australia; and metropolitan newspaper and a national newspaper in the United States, as well as offers various information services.
Its Other segment sells advertising, sponsorships, and subscription services on the company's various digital media; and outdoor advertising space on various media, primarily in the Russian Federation and eastern Europe. This segment also provides mobile entertainment services.
This article is part of a series of case studies we are conducting for various 401K plans. In this article, we will discuss how participants in News America (News Corp) 401k Savings Plan can achieve reasonable investment results using asset allocation strategies. We will also discuss how those portfolios are positioned in today’s market environment.This plan is the News Corp (Ticker: NWS, NWSA) 401k Savings Plan. It has Self-Directed Brokerage option for participants.
News America (News Corp) 401k Savings Plan's 401K plan consists of 8 funds. These funds enable participants to gain exposure to 3 major assets: US Equity, Foreign Equity, Fixed Income. The list of minor asset classes covered:
US EQUITY News Corporation Stock Fund Class A (nonvoting) US EQUITY News Corporation Stock Fund Class B (voting) MID-CAP VALUE Hartford Cap App Y SMALL VALUE Allianz NFJ Small Cap Value Fund Inst Intermediate-Term Bond PIMCO Total Return Institutional Foreign Large Blend DWS International Fund S LARGE BLEND Spartan US Equity Index WORLD STOCK Templeton Growth Adv Given that two of the options are company stock which is going to suffer from high volatility, the choices are somewhat restrictive and the lack of asset classes make this an old style plan.
As of Oct 26, 2010, this plan investment choice is rated as average based on MyPlanIQ Plan Rating methodology that was designed to measure how effective a plan's available investment funds are . It has the following detailed ratings:Diversification -- Rated as poor (4%)
Fund Quality -- Rated as average (49%)
Portfolio Building -- Rated as average (65%)
Overall Rating: average (42%)The chart and table below show the historical performance of moderate model portfolios employing strategic and tactical asset allocation strategies ( SAA and TAA , both provided by MyPlanIQ). For comparison purpose, we also include the moderate model portfolios of a typical 3 asset SIB (Simpler Is Better) plan . This SIB plan has the following candidate index funds and their ETFs equivalent:
US Equity: SPY or VTI
Foreign Equity: EFA or VEU
Fixed Income: AGG or BND
Performance chart (as of Oct 26, 2010)Performance table (as of Oct 26, 2010)
Portfolio Name 1Yr AR 1Yr Sharpe 3Yr AR 3Yr Sharpe 5Yr AR 5Yr Sharpe News America (News Corp) 401k Savings Plan Tactical Asset Allocation Moderate 7% 56% 6% 64% 10% 91% News America (News Corp) 401k Savings Plan Strategic Asset Allocation Moderate 10% 114% 3% 18% 7% 44% Three Core Asset ETF Index Funds Tactical Asset Allocation Moderate -0% -3% 2% 12% 5% 46% Three Core Asset ETF Index Funds Strategic Asset Allocation Moderate 11% 81% -0% -4% 5% 20% Currently, asset classes in US Equity ( SPY , VTI ) , Foreign Equity ( EFA , VEU ) and Fixed Income ( AGG , BND ) are doing relatively well. These asset classes are available to News America (News Corp) 401k Savings Plan participants.
To summarize, News America (News Corp) 401k Savings Plan plan participants can achieve reasonable investment returns by adopting asset allocation strategies that are tailored to their risk profiles. Currently, the tactical asset allocation strategy indicates overweighing on US Equity , Foreign Equity and Fixed Income funds.
labels:investment,
Symbols:VTI,EFA,VEU,AGG,BND,IVV,IYY,IWV,VV,DLN,RSP,SCHX,CIU,BIV,GWL,PFA,IOO,VT,IJJ,IWS,JKI,VOE,EMV,PWP,RFV,UVU,IJS,IWN,JKL,VBR,DSV,PWY,RZV,UVT,
- Ford Motor Company 401K Plan: Diversified and High Quality
10/24/2010
- TD Ameritrade Commission Free ETF’s Empowers Both Strategic and Tactical Asset Allocation
10/19/2010
- Apple 401K: A Great Company with an Average Retirement Plan
10/19/2010
- Schwab ETFs Review
07/27/2010
- Investing with Styles Can Pay off
07/09/2010
- Aflac Incorporated 401(k) Savings and Profit Sharing Plan Report On 12/03/2010
12/03/2010
This report reviews Aflac Incorporated 401(k) Savings and Profit Sharing Plan plan. We will discuss the investment choices and present the plan rating by MyPlanIQ. Current economic and market conditions are discussed in the context of the investment portfolios in the plan. We will then show how participants in Aflac Incorporated 401(k) Savings and Profit Sharing Plan can achieve reasonable investment results using asset allocation strategies.
Plan Review and Rating
AFLAC Inc (Ticker:AFL) has the "Aflac Incorporated 401(k) Savings and Profit Sharing Plan".
Aflac Incorporated 401(k) Savings and Profit Sharing Plan's 401K plan consists of 11 funds. These funds enable participants to gain exposure to 3 major assets: US Equity, Foreign Equity, Fixed Income. The list of minor asset classes covered:
Foreign Large Blend: EFA, VEU, GWL, PFA
Intermediate-term Bond: AGG, CIU, BIV, BND
Large Blend: IVV, IYY, IWV, VTI, VV, SPY, DLN, RSP, SCHX
Large Growth: IVW, IWZ, JKE, VUG, ELG, QQQQ, RPG, SCHG
Large Value: IVE, IWW, JKF, VTV, ELV, PWV, RPV, SCHV
Mid-cap Growth: IJK, IWP, VOT, EMG, PWJ, RFG, UKW
Moderate Allocation: AOM
Small Growth: IJT, IWO, JKK, VBK, DSG, PWT, RZG, UKK
As of Dec 2, 2010, this plan investment choice is rated as based on MyPlanIQ Plan Rating methodology that measures the effectiveness of a plan's available investment funds. It has the following detailed ratings:
Diversification -- Rated as (35%)
Fund Quality -- Rated as (33%)
Portfolio Building -- Rated as (36%)
Overall Rating: (35%)Current Economic and Market Conditions
We have experienced an uncertain 2010: plenty of worries on whether the US economy will climb out of the great recession and recover.
- The Federal Reserve embarked on Quantitative Easing II (QE2) to stimulate the economy.
- The housing market is still at its low but largely stabilized.
- The unemployment rate is stuck at 9%.
Americans continue to face an uncertain future, given (among others) the high unemployment rate, large federal and local government debts and global trade imbalance. With such an economic backdrop, the stock and debt markets are going to be volatile. Despite this, markets have been resilient and appear positioned to rebound.
In this market it is even more critical to properly diversify and respond market changes. MyPlanIQ offers two asset allocation strategies: strategic and tactical asset allocation strategies ( SAA and TAA for participants in Aflac Incorporated 401(k) Savings and Profit Sharing Plan).
Strategic Asset Allocation is based on well known modern portfolio theory and its key features include: diversification, proper fund selection and periodically re-balancing.
Tactical Asset Allocation works on a diversified array of assets provided by funds in a plan and adjusts asset mixes based on market conditions such as asset price momentum utilized by TAA.
Portfolio Discussions
The chart and table below show the historical performance of moderate model portfolios employing strategic and tactical asset allocation strategies. For comparison purpose, we also include the moderate model portfolios of a typical 3 asset SIB (Simpler Is Better) plan . This SIB plan has the following candidate index funds and their ETFs equivalent:
US Equity: (SPY or VTI)
Foreign Equity: (EFA or VEU)
Fixed Income: (AGG or BND)
Performance chart (as of Dec 2, 2010)Performance table (as of Dec 2, 2010)
Portfolio Name 1Yr AR 1Yr Sharpe 3Yr AR 3Yr Sharpe 5Yr AR 5Yr Sharpe Aflac Incorporated 401(k) Savings and Profit Sharing Plan Tactical Asset Allocation Moderate 4% 34% 5% 64% 8% 81% Aflac Incorporated 401(k) Savings and Profit Sharing Plan Strategic Asset Allocation Moderate 10% 100% 2% 8% 6% 31% Three Core Asset ETF Index Funds Tactical Asset Allocation Moderate -4% -35% 1% 9% 4% 27% Three Core Asset ETF Index Funds Strategic Asset Allocation Moderate 9% 60% -0% -3% 4% 13% Currently, asset classes in US Equity (SPY,VTI), Foreign Equity (EFA,VEU) and Fixed Income (AGG,BND) are doing relatively well. These asset classes are available to Aflac Incorporated 401(k) Savings and Profit Sharing Plan participants.
To summarize, Aflac Incorporated 401(k) Savings and Profit Sharing Plan plan participants can achieve reasonable investment returns by adopting asset allocation strategies that are tailored to their risk profiles.
Symbols: AFL , SPY , VTI , EFA , VEU , AGG , BND , AOM , CIU , BIV , GWL , PFA , IVE , IWW , JKF , VTV , ELV , PWV , RPV , SCHV , IVV , IYY , IWV , VV , DLN , RSP , SCHX , IVW , IWZ , JKE , VUG , ELG , QQQQ , RPG , SCHG , IJK , IWP , VOT , EMG , PWJ , RFG , UKW , IJT , IWO , JKK , VBK , DSG , PWT , RZG , UKK
- ALLERGAN, INC. SAVINGS AND INVESTMENT PLAN Report On 12/03/2010
12/03/2010
- Apartment Investment and Management Company 401(k) Retirement Plan Report On 12/03/2010
12/03/2010
- ASSURANT 401(k) PLAN A&PLAN B Report On 12/03/2010
12/03/2010
- Abercrombie Fitch Co. Savings and Retirement Plan Report On 12/03/2010
12/03/2010
- Apache Design Solutions 401K Report On 12/03/2010
12/03/2010
- Allegheny Ludlum Corporation Personal Retirement and 401(k) Savings Account Plan Report On 12/03/2010
12/03/2010
- AMERICAN EXPRESS RETIREMENT SAVINGS PLAN Report On 12/03/2010
12/03/2010
- ALLEGHENY ENERGY EMPLOYEE STOCK OWNERSHIP AND SAVINGS PLAN Report On 12/03/2010
12/03/2010
- BAKER 401(k) PLAN Report On 12/03/2010
12/03/2010
- BRISTOL-MYERS SQUIBB COMPANY SAVINGS AND INVESTMENT PROGRAM Report On 12/03/2010
12/03/2010
- PEABODY WESTERN-UMWA 401(K) PLAN Report On 12/03/2010
12/03/2010
- Peabody Investments Corp.Employee Retirement Account Report On 12/03/2010
12/03/2010
- Capital Accumulation Plan of The Chubb Corporation Report On 12/03/2010
12/03/2010
- CEPHALON, INC. 401(k) PROFIT SHARING PLAN Report On 12/03/2010
12/03/2010
- CABOT OIL & GAS CORPORATION SAVINGS INVESTMENT PLAN Report On 12/03/2010
12/03/2010
- CVS CAREMARK CORPORATION AND AFFILIATED COMPANIES Report On 12/03/2010
12/03/2010
- Danaher Corporation Subsidiaries Retirement and Savings Plan Report On 12/03/2010
12/03/2010
- Danaher Corporation Subsidiaries Savings Plan Report On 12/03/2010
12/03/2010
- EQT CORPORATION SAVINGS AND PROTECTION PLAN Report On 12/03/2010
12/03/2010
- Vanguard Variable Annuity Report On 12/06/2010
12/06/2010
- The Franklin Templeton NJBEST New Jersey 529 College Savings Plan Report On 12/07/2010
12/07/2010
- TD Ameritrade Commission Free ETFs Report On 12/07/2010
12/07/2010
- Qualcomm 401(k) Plan Report On 12/07/2010
12/07/2010
- Vanguard-VA-Clone Report On 12/07/2010
12/07/2010
- Tiffany Co. Employee Profit Sharing and Retirement Savings Plan Report On 03/21/2011
03/21/2011
- Sprint Nextel 401K Plan Report On 03/21/2011
03/21/2011