 |
Vanguard ETF: |  |
7.4%* |
|
Diversified Core: | |
8.1%* |
|
Six Core Asset ETFs: | |
7.3%* |
Articles on IWM
- Top Tier ETF Provider Playoffs
10/19/2010
ETF’s continue to broaden their appeal both in terms of flexibility and low cost. With commission free ETF’s, more money stays in the investors pocket rather than disappearing in fees. In addition, while many of these ETF’s have a 30 day minimum hold, this is ideal for long term investing when making changes more often than that can be counter productive.
Four companies offer commission free ETF’s and we are going to compare the offerings in detail to determine which is likely to offer the best value to the investor.
In this article we are going to compare Schwab and TD Ameritrade.
Schwab (Ticker SCHW) is a relative late comer to the ETF party. They offer the fewest ETF’s and the ETF’s have the shortest history. They only provide their own ETF's commission free. However, Schwab has a huge network and powerful brand so we expect Schwab to be a significant player in the market.
Schwab ETFNEW Bond ETFsSchwab U.S. TIPS ETF™Schwab Short-Term U.S. Treasury ETF™Schwab Intermediate-Term U.S. Treasury ETF™Domestic Equity ETFsSchwab U.S. Broad Market ETF™Schwab U.S. Large-Cap ETF™Schwab U.S. Large-Cap Growth ETF™Schwab U.S. Large-Cap Value ETF™Schwab U.S. Small-Cap ETF™International Equity ETFsSchwab International Equity ETF™Schwab International Small-Cap Equity ETF™Schwab Emerging Markets Equity ETF™Notable properties about the Schwab offering- The expense ratios are low
- There are four asset classes with a good choice of funds
- We would have liked to have seen more choices with other providers
- We would have liked to have seen funds with a longer history
- We would expect real estate to be added before long
- We would expect more choices in the international and emerging market segments before long
As most of the funds are very new, it’s impossible to do real back testing with the funds. So we have selected a commission efficient portfolio that includes:Asset Class Ticker Name LARGE VALUE SCHV Schwab U.S. Large-Cap Value ETF LARGE BLEND SCHX Schwab U.S. Large-Cap ETF LARGE BLEND SCHB Schwab U.S. Broad Market ETF LARGE GROWTH SCHG Schwab U.S. Large-Cap Growth ETF LARGE GROWTH IWF iShares Russell 1000 Growth Index SMALL VALUE IJS iShares S&P SmallCap 600 Value Index SMALL BLEND SCHA Schwab U.S. Small-Cap ETF Small Growth IJT iShares S&P SmallCap 600 Growth Foreign Large Blend SCHF Schwab International Equity ETF FOREIGN SMALL/MID GROWTH SCHC Schwab International Small-Cap Eq ETF DIVERSIFIED EMERGING MKTS SCHE Schwab Emerging Markets Equity ETF Inflation-Protected Bond TIP iShares Barclays TIPS Bond Intermediate Government IEI iShares Barclays 3-7 Year Treasury Bond SHORT GOVERNMENT SHY iShares Barclays 1-3 Year Treasury Bond Inflation-Protected Bond SCHP Schwab U.S. TIPS ETF SHORT GOVERNMENT SCHO Schwab Short-Term U.S. Treasury ETF Intermediate Government SCHR Schwab Intermediate-Term U.S. Trsy ETF LARGE VALUE VTV Vanguard Value Index LARGE BLEND VTI Vanguard Total Stock Market ETF LARGE VALUE VTV Vanguard Value ETF DIVERSIFIED EMERGING MKTS VWO Vanguard Emerging Markets Stock ETF Foreign Small/Mid Value SCZ iShares MSCI EAFE Small Cap Index Foreign Large Blend EFA iShares MSCI EAFE Index
As of Oct 15, 2010, the Schwab ETF investment choice is rated asaverage based on MyPlanIQ Plan Rating methodology that was designed to measure how effective a plan's available investment funds are . It has the following detailed ratings:
Diversification -- Rated as below average (19%)
Fund Quality -- Rated as average (59%)
Portfolio Building -- Rated as average (41%)
Overall Rating: average (40%)
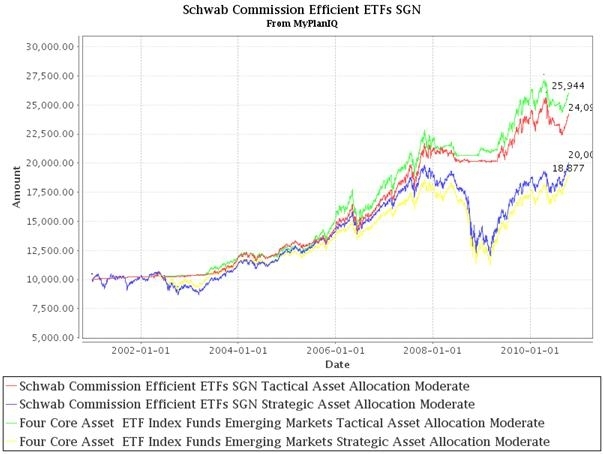
The chart and table below show the historical performance of moderate model portfolios employing strategic and tactical asset allocation strategies ( SAA and TAA , both provided by MyPlanIQ).
For comparison purpose, we also include the moderate model portfolios of a typical five asset SIB (Simpler Is Better) plan . This SIB plan has the following candidate index funds and their ETFs equivalent:Fixed Income:( AGG or BND )
Foreign Equity:( EFA or VEU )
Emerging Market Equity:( EEM or VWO )
US Equity:( SPY or VTI )
Performance chart (as of Oct 15, 2010)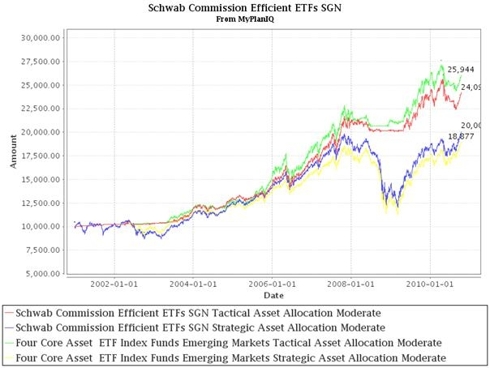
Performance table (as of Oct 15, 2010)Portfolio Name1Yr AR1Yr Sharpe3Yr AR3Yr Sharpe5Yr AR5Yr Sharpe2%17%6%44%14%88%1%10%5%38%12%88%10%71%1%2%9%40%10%76%1%4%8%37%
The Schwab Funds perform adequately against the SIB’s.TD Ameritrade (Ticker: AMTD) are also newcomers to the ETF space offering 100+ commission free ETFs. The main restriction is that customers have to hold these ETFs for more than 30 days to make such trades ecommission free.
This is an almost ideal platform for retirement investing with a 30 day redemption period. With a web based application to monitor all of the funds in the plan, it should be possible to put together a very solid portfolio and deliver excellent results.
These funds provide exposure to 6 major assets: Emerging Market Equity , Foreign Equity , Fixed Income , US Equity , Commodity , Real estate.
The list of minor asset classes covered:COMMODITIES BROAD BASKET: GSG , DBC
Conservative Allocation: AOK
DIVERSIFIED EMERGING MKTS: EEM , GMM , PXH , DEM , SCHE
Emerging Markets Bond: PCY
EQUITY: VTI,VT
EUROPE STOCK: IEV , VGK , PEF , DEB
Foreign Large Blend: EFA , VEU , GWL , PFA
Foreign Large Growth: EFG
Foreign Large Value: EFV , PID , DWM
FOREIGN SMALL/MID GROWTH: IFSM , VSS , SCHC
Foreign Small/Mid Value: SCZ
Global Real Estate: IFGL , RWX
High Yield Bond: HYG , JNK , PHB
Inflation-Protected Bond: TIP
Intermediate Government: IEI , VGIT , ITE
Intermediate-Term Bond: AGG,CIU , BIV,BND
JAPAN STOCK: EWJ , JPP , PJO , DXJ
LARGE BLEND: IVV,IYY,IWV , VTI,VV , SPY , DLN , RSP , SCHX
LARGE GROWTH: IVW,IWZ,JKE , VUG , ELG , QQQQ , RPG , SCHG
LARGE VALUE: IVE,IWW,JKF , VTV , ELV , PWV , RPV , SCHV
Latin America Stock: ILF , GML
LONG GOVERNMENT: TLT,TLH,IEF , EDV,VGLT , TLO , PLW
Long-Term Bond: CLY,LQD , BLV,VCLT
MID-CAP BLEND: IJH,IWR,JKG , VO , MDY,EMM , PJG , DON,EZM , MVV
Mid-Cap Growth: IJK,IWP , VOT , EMG , PWJ , RFG , UKW
MID-CAP VALUE: IJJ,IWS,JKI , VOE , EMV , PWP , RFV , UVU
Moderate Allocation: AOM
Multisector Bond: AGG,GBF , BND , LAG
Muni National Interm: ITM
Muni National Long: MUB , TFI , PZA , MLN
Muni National Short: SUB , SHM , PVI , SMB
PACIFIC/ASIA EX-JAPAN STK: EPP,AAXJ , GMF , PAF , DND
REAL ESTATE: IYR,ICF , VNQ
SHORT GOVERNMENT: SHY,SHV , VGSH , PLK , USY
Short-Term Bond: CSJ , BSV,VCSH
SMALL BLEND: IJR,IWM,JKJ , VB , DSC , PJM , DES , SAA,UWM , SCHA
Small Growth: IJT,IWO,JKK , VBK , DSG , PWT , RZG , UKK
SMALL VALUE: IJS,IWN,JKL , VBR , DSV , PWY , RZV , UVT
SPECIALTY-REAL ESTATE: RWR , PSR , URE
World Allocation: AOR , AOA
WORLD BOND: IGOV , BWX,WIP
WORLD STOCK: IOO , VT
As of Oct 15, 2010, this plan investment choice is rated as above average based on MyPlanIQ Plan Rating methodology that was designed to measure how effective a plan's available investment funds are . It has the following detailed ratings:
Diversification -- Rated as great (97%)
Fund Quality -- Rated as below average (28%)
Portfolio Building -- Rated as great (90%)
Overall Rating: above average (73%)
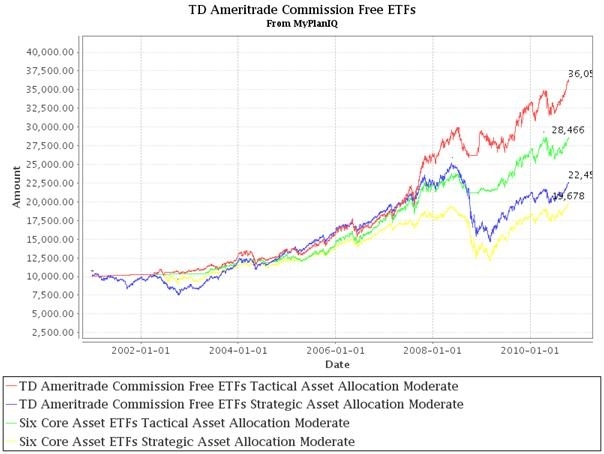
The chart and table below show the historical performance of moderate model portfolios employing strategic and tactical asset allocation strategies ( SAA and TAA , both provided by MyPlanIQ).
For comparison purpose, we also include the moderate model portfolios of a typical five asset SIB (Simpler Is Better) plan . This SIB plan has the following candidate index funds and their ETFs equivalent:
REITs:( IYR or VNQ or ICF )
Fixed Income:( AGG or BND )
Commodity:(DBC)
Foreign Equity:( EFA or VEU )
Emerging Market Equity:( EEM or VWO )
US Equity:( SPY or VTI )
Performance chart (as of Oct 15, 2010)
Performance table (as of Oct 15, 2010)Portfolio Name1Yr AR1Yr Sharpe3Yr AR3Yr Sharpe5Yr AR5Yr Sharpe13%87%13%86%20%128%10%83%-1%-6%9%46%10%65%9%66%17%114%11%84%2%9%9%42%
Currently, asset classes in REITs( IYR , VNQ , ICF ) , Fixed Income( AGG , BND ) and Emerging Market Equity( EEM , VWO ) are doing relatively well. These asset classes are available to TD Ameritrade Commission Free ETFs participants.
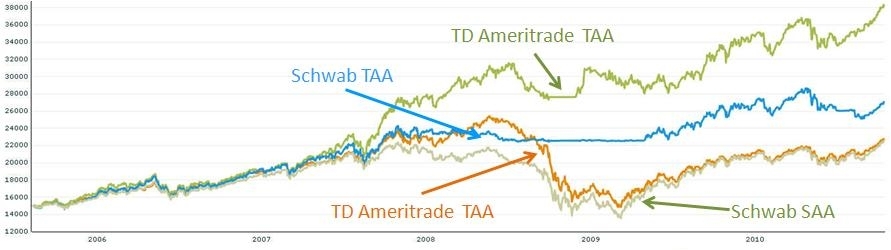
 Portfolio Performance ComparisonPortfolio Name1Yr AR1Yr Sharpe3Yr AR3Yr Sharpe5Yr AR5Yr Sharpe13%87%13%86%20%128%1%10%5%38%12%88%10%83%-1%-6%9%46%10%71%1%2%9%40%In this round, TD Ameritrade is the clear winner with tactical asset allocation while the Schwab SAA pretty much matches its counterpart.
TD Ameritrade's two key advantages are:- A large number of ETF’s in six asset classes to allow the construction of high performance portfolios
- Providing ETF’s with history from industry leading suppliers
TD Ameritrade is the clear winner and moves on to the final round.labels:investment,
Symbols:SUB,SHM,PVI,SMB,EPP,AAXJ,GMF,PAF,DND,SHY,SHV,VGSH,PLK,USY,CSJ,BSV,VCSH,AOR,AOA,IGOV,BWX,WIP,IOO,VT,RWR,PSR,URE,IJS,IWN,JKL,VBR,DSV,PWY,RZV,UVT,IJT,IWO,JKK,VBK,DSG,PWT,RZG,UKK,IJR,IWM,JKJ,VB,DSC,PJM,DES,SAA,UWM,SCHA,ITM,MUB,TFI,PZA,MLN,AGG,GBF,BND,LAG,IJJ,ETFs,Portfolio,Building,Asset,Allocation,Commission,Free,
- Apple 401K: A Great Company with an Average Retirement Plan
10/19/2010
As one of the gee-whiz high tech companies, Apple Inc. (AAPL) is well known for its innovative consumer products such as Macs, iPods, iPhones and iPads. It is also a known fact for many high tech workers in San Francisco Bay Area that Apple provides wonderful employee benefits. In this article, we take a closer look at Apple's 401K plan'sfund lineups and its rating. We then discuss how participants in Apple 401K can achieve reasonable investment results using asset allocation strategies. We will also discuss how those portfolios are positioned in today’s market environment.
Apple 401K's 401K plan consists of 14 funds. These funds enable participants to gain exposure to 4 major assets: Fixed Income , US Equity , Foreign Equity , REITs . The list of minor asset classes covered:
Foreign Large Blend: EFA , VEU , GWL , PFAGlobal Real Estate: IFGL , RWXHigh Yield Bond: HYG , JNK , PHBIntermediate-Term Bond: AGG,CIU , BIV,BNDLARGE BLEND: IVV,IYY,IWV , VTI,VV , SPY , DLN , RSP , SCHXLARGE GROWTH: IVW,IWZ,JKE , VUG , ELG , QQQQ , RPG , SCHGModerate Allocation: AOMSMALL BLEND: IJR,IWM,JKJ , VB , DSC , PJM , DES , SAA,UWM , SCHAAs of 10/12/2010, this plan investment choice is rated as Averagebased on MyPlanIQ Plan Rating methodology that was designed to measure how effective a plan's available investment funds are . It has the following detailed ratings:Diversification -- Rated as above average (80%)Fund Quality -- Rated as poor (9%)Portfolio Building -- Rated as above average (75%)Overall Rating: average (57%)The chart and table below show the historical performance of moderate model portfolios employing strategic and tactical asset allocation strategies ( SAA and TAA , both provided by MyPlanIQ). For comparison purpose, we also include the moderate model portfolios of a typical four asset SIB (Simpler Is Better) plan . This SIB plan has the following candidate index funds and their ETFs equivalent:
REITs:( IYR or VNQ or ICF )Fixed Income:( AGG or BND )Foreign Equity:( EFA or VEU )US Equity:( SPY or VTI )
Performance Chart (As of 10/12/2010)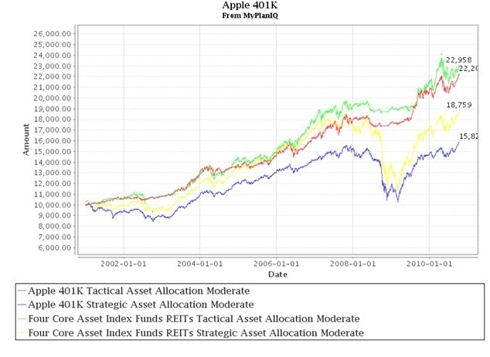
Performance table
Portfolio Name
1Yr AR
1Yr Sharpe
3Yr AR
3Yr Sharpe
5Yr AR
5Yr Sharpe
9%
88%
7%
82%
10%
104%
9%
119%
1%
2%
5%
30%
Four Core Asset Index Funds REITs Tactical Asset Allocation Moderate
11%
78%
5%
48%
10%
91%
Four Core Asset Index Funds REITs Strategic Asset Allocation Moderate
13%
98%
0%
-0%
6%
24%
Currently, asset classes in REITs, Fixed Income and High Yield Bonds are doing relatively well. These asset classes are available to Apple 401K participants.
To summarize, Apple 401K plan participants can achieve reasonable investment returns by adopting asset allocation strategies that are tailored to their risk profiles. Currently, funds the tactical asset allocation strategy over weighs include REITs and High Yield Bonds. However, Apple can do better to her employees by improving its fund selection such as making better funds available.labels:investment,
Symbols:SPY,IVV,IWV,VTI,VV,DLN,IVW,IWZ,JKE,VUG,ELG,QQQQ,RPG,SCHG,AOM,IWM,IJR,VB,DSC,JKJ,SCHA,AGG,BND,CIU,BIV,HYG,JNK,PHB,EFA,VEU,GWL,PFA,ETFs,Portfolio,Building,401K,
labels: investment
Symbols: SPY, IVV, IWV, VTI, VV, DLN, IVW, IWZ, JKE, VUG, ELG, QQQQ, RPG, SCHG, AOM, IWM, IJR, VB, DSC, JKJ, SCHA, AGG, BND, CIU, BIV, HYG, JNK, PHB, EFA, VEU, GWL, PFA, ETFs, Portfolio Building, 401K
- Lazy Portfolios -- The Playoffs II
10/19/2010
This is the second article as we attempt to whittle down the lazy portfolios to four finalists for great analysis of what makes for a great portfolio. We are in the bottom half of the alphabetical list and the eight are listed in reducing order asset classes and funds. We have stated that the winners should be those with the most asset classes and highest number of funds.
Portfolio Classes Funds ETF Equivalent Seven-12 7 12 Y SIX SIB SAA 6 6 y Gone Fishin' 5 10 y Swensen 6 4 6 Y Wasik`s Nano 4 5 Y Harry Browne 3 4 Y Schultheis 3 3 Y Lowell 2 8 Y We are using this series of comparisons to validate whether this proves to be true.- Craig L. Israelsen, Ph.D., is an Associate Professor at Brigham Young University. The Seven Equally Weighted, twelve fund portfolio is aimed to protect against losses.
- The MyPlanIQ six asset SIB has index funds for each of the asset classes represented and rebalances monthly – this is primarily a benchmark portfolio
- Alexander Green proposed this The Gone Fishin' Portfolio which was outlined in his book 'The Gone Fishin' Portfolio'
- David Swensen, the Yale Endowment Manager, proposed this one size fit in all model portfolio for individual investors.
- John Wasik has been a professional journalist and author for 30 years specializing in personal finance. John proposed a portfolio which employs a handful of index or ETFs
- Harry Browne is the author of Fail-Safe Investing
- Bill Schulthe is is a former Smith Barney broker and author of "The Coffeehouse Investor."
- Jim Lowell edits MarketWatch's ETF Trader, an investment letter employing a momentum-based exchange-traded-fund strategy for long-term investors.
The returns are now presented in order of highest to lowest of the five year returns. How do the returns compare to what we would have expected?
Portfolio/AR(%) 1 Yr 3 Yr 5 Yr Inception Harry Browne 12.49 7.40 8.99 7.31 Six SIB SAA 12.54 1.61 7.44 8.26 Seven-12 15.55 0.80 6.41 6.16 Swensen Six 15.10 (0.24) 6.21 7.10 Gone Fishin' 12.98 (0.34) 5.64 6.72 Wasik`s Nano 15.34 (1.93) 4.74 4.66 Schultheis 9.23 (2.28) 4.68 4.59 Lowell 12.45 (6.26) 3.55 6.74 - The portfolios roughly follow the asset class/fund class as would be expected
- The Harry Browne portfolio stands out as the clear exception to the rule – it has a signnificant lead over the other portfolios
- The six asset SIB performed well – that was expected. Six asset classes with index funds should perform well
When we look at the drawdown for each of the portfolios, it will reveal which is the most painful to own.Portfolio/DD1 Yr3 Yr5 YrInceptionHarry Browne5%15%15%15%Swensen Six8%39%39%39%Six SIB SAA8%39%39%39%Schultheis9%39%39%39%Seven-128%40%40%40%Gone Fishin'9%42%42%42%Wasik`s Nano9%44%44%44%Lowell16%57%57%57%
Again the Harry Browne portfolio is the clear winner.
We select the top two – which are the Harry Browne and Six asset SIB to move to the final round where they will be put against the best two funds from the top half of the alphabet.
Takeaways- The portfolios followed the expected path against asset classes and funds
- The Harry Browne portfolio was the clear winner and was the exception – we will find out in the final article whether it proves the rule
- With the exception of the Harry Browne portfolio, the drawdown ratios are uncomfortably high
- ETF’s can be used to implement any of these strategies
labels:investment,
Symbols:ACWI,ACWX,ADRE,AGG,BIV,BLV,BND,BSV,BWX,CFT,CIU,CSJ,DBC,DBV,DIA,DVY,EDV,EEM,EFA,EFG,EFV,EMB,ETF,GLD,GOOG,GSG,GXC,HPQ,HYG,ICF,IEF,IEI,IFGL,IGOV,IGR,IJH,IJJ,IJK,IJR,IJS,IJT,IVE,IVV,IVW,IWB,IWC,IWD,IWF,IWM,IWN,Portfolio-Building,with,ETFs,Closed-End,Funds,Commodity,ETFs,Currency,ETFs,Developed,Market,ETFs,
- Lazy Portfolios -- The Playoffs
10/19/2010
We have compared the performance of fifteen buy and hold portfolios from investing luminaries. Each of the portfolios was measured for performance against SIBs and their relative merits examined. We now move into a playoff round where we will compare the portfolios with each other and see if we can find an eventual winner and look at why they won and what we can learn from this.
When we were testing the portfolios against SIBs, we introduced a tactical asset allocation strategy which usually turned out to have the best performance. For this series of peer comparisons, we are only going to use a buy and hold strategy. When we find the eventual winner, we will then perform a final comparison with tactical asset allocation and see what we conclude.
The portfolios have been sorted alphabetically and we are going to start with the top part of the alphabet. The portfolios will be listed by decreasing number of asset classes and decreasing number of funds. We would expect that the portfolio with the greatest number of asset classes to have the highest returns and we will test that to see to what extent it is true.
Table of Lazy Portfolios and their classes and fundsPortfolio Classes Funds ETF Equivalent Fund Advice 5 11 Y Gibson 5 6 y Five SIB SAA 5 5 Y Aronson 4 11 y Armstrong 4 7 y Four SIB SAA 4 4 Y Burns/Tobias 3 3 Y - Paul Merriman's FundAdvice.com website has indexed porfolios for several fund companies. The basic strategy is the same as with all the other Lazy Portfolios, here with 11 no-load index funds
- Gibson's 5 Equal Asset Allocation Strategy comes from Roger Gibson’s widely read "Asset Allocation: Balancing Financial Risks.”
- The MyPlanIQ five asset SIB has index funds for each of the asset classes represented and rebalances monthly – this is primarily a benchmark portfolio
- Ted Aronson and his AJO Partners manage about $25 billion of institutional assets. Aronson puts his family's taxable money in this well-diversified portfolio of no-load index funds
- Frank Armstrong, author of The Informed Investor, proposed his portfolio for an MSN Money article
- The MyPlanIQ four asset SIB has index funds for each of the asset classes represented and rebalances monthly – this is primarily a benchmark portfolio
- Scott Burns has covered personal finance and investments for nearly 40 years and ranks as one of the most widely read personal finance writers in the country/ Andrew Tobias, a Harvard alum and writer of 12 books including The Only Investment Guide You'll Ever Need.
Table of Lazy Portfolios and their Annual ReturnsPortfolio/AR(%) 1 Yr 3 Yr 5 Yr Inception Five SIB SAA 14.27 1.73 7.67 8.38 Four SIB SAA 10.76 0.17 7.11 7.40 Fund Advice 10.85 0.24 6.06 6.75 Armstrong 11.69 (1.76) 5.15 5.55 Burns/Tobias 0.45 (2.32) 4.54 4.48 Aronson 8.46 (1.10) 3.48 3.59 Gibson 8.63 (4.72) 0.08 3.43 The returns are now presented in order of highest to lowest of the five year returns. How do the returns compare to what we would have expected.- There was a wider spread than expected on the four and five asset class portfolios and the Burns/Tobias three asset class, three fund portfolio performed better than expected
- A five asset class portfolio came out on top – that was expected. The fact that an index based portfolio won out it also not surprising as index funds often outperform funds with active management
- The fact that a four asset portfolio beat a five asset portfolio demonstrates that picking the right funds in an asset class is important and that index funds deliver good results
- For a very simple three asset portfolio, the Burns/Tobias performance came higher in the league table
- The most surprising result is that the Gibson portfolio performed so poorly. When breaking down the long term results of this portfolio, the selection of asset classes has given the portfolio a modest return with a low drawdown index. In the significant market downturn over the past few years, it suffered (as did most buy and hold strategies) badly and has returned to its modest gains whereas other portfolios have had a higher drawdown ratio but a faster recovery
Table of Lazy Portfolios and their Draw Down RatiosPortfolio/DD 1 Yr 3 Yr 5 Yr Inception Aronson 6% 30% 30% 30% Fund Advice 9% 38% 38% 38% Gibson 7% 38% 38% 38% Four SIB SAA 9% 40% 40% 40% Five SIB SAA 8% 41% 41% 41% Scott Burns 9% 41% 41% 41% Armstrong 11% 44% 44% 44% We list the draw down ratios for each of the portfolios and it’s clear that with the recent turbulence, all of them are higher than would be desired.We will select the top two – which are the four and five asset SIBs to move to the final round where they will be put against the best two funds from the bottom half of the alphabet.
Takeaways- Asset classes and number of funds in each class are an indicator of better returns but it’s not the only thing
- Index funds continue to show good results against managed funds
- or those investing in the very long term, looking at the draw down index is important because it will help you live with the fund selection you have made
- ETF’s can be used to implement any of these strategies
labels:investment,
Symbols:ACWI,ACWX,ADRE,AGG,BIV,BLV,BND,BSV,BWX,CFT,CIU,CSJ,DBC,DBV,DIA,DVY,EDV,EEM,EFA,EFG,EFV,EMB,ETF,GLD,GOOG,GSG,GXC,HPQ,HYG,ICF,IEF,IEI,IFGL,IGOV,IGR,IJH,IJJ,IJK,IJR,IJS,IJT,IVE,IVV,IVW,IWB,IWC,IWD,IWF,IWM,IWN,Portfolio-Building,with,ETFs,Closed-End,Funds,Commodity,ETFs,Currency,ETFs,Developed,Market,ETFs,
- Dow Theory Revisited, Reviewed, Compared
10/08/2010
In this article we are going to revisit Dow Theory -- the grand-daddy of all portfolio strategies and then compare it with more modern approaches. We will look at Shiller, a long term but newer approach and then modern portfolio theory which is based on asset allocation.
The Dow Theory is one of the most venerable strategies. It uses the price trends of the Dow Jones Industrial index (^DJI) and the Dow Jones Transportation Index (^DJT) to decide whether to invest in the stock market.The Dow Theory has been around for almost 100 years, yet even in today’s volatile and technology-driven markets, the basic components of Dow theory still remain valid. Developed by Charles Dow, refined by William Hamilton and articulated by Robert Rhea, the Dow Theory addresses not only technical analysis and price action, but also market philosophy. Many of the ideas and comments put forth by Dow and Hamilton became axioms of Wall Street.
Today, there are a variety of strategies
There are multiple interpretations of the original Dow Theory. This strategy represents a typical version: all the buy and sell signals are confirmed by both the Dow Jones Industrial Average and Dow Jones Transportation Average.
The Dow Jones Transportation Average is used to triangulate the Dow Jones Industrial Average to ensure that an upward or downward trend is not just a localized phenomenon.
The buy signal- A primary low is established
- A secondary bounce
- A pullback of around 3% but above previous lows
- Both averages hold above the prior lows
- Both averages exceed the secondary bounce
The sell signal- A primary high is established
- A secondary drop
- A rally of over 3% but falls short of the previous high
- A drop of both averages below the previous drop
The funds in the portfolio are (ETF alternatives):- Wilshire 5000 total return index ^DWC (VTI, SPY, IWM)
- Cash (BND)
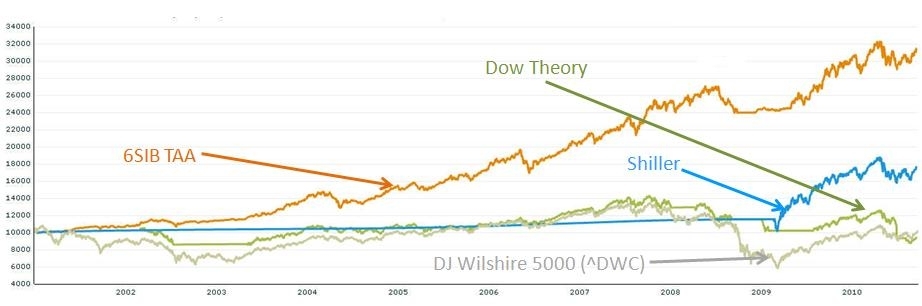
This is a long established strategy and should be reviewed to see how it performs in more recent operating conditions. To achieve this, we will compare results with another long term plan – Shiller, a modern portfolio (a 6 asset SIB with tactical asset allocation) and the total market (^DWC).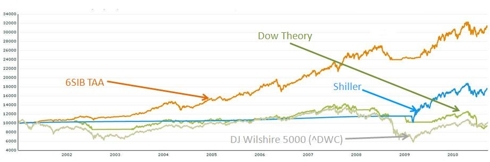
Click here for the interactive graphHistorical Returns for Dow Theory, Shiller and 6SIB TAA Annual Returns 1 Year 3 Years 5 Years Dow Theory -14% -12% -2% Shiller 8% 16% 11% 6 SIB TAA 9% 10% 13%
The Dow Theory has not been effective in the last ten years given the prevailing market conditions. It is possible that a different investment portfolio would perform better but given that Shiller is using similar funds, Shiller appears to be a better choice.
Today, Dow Theory is signallingTakeaways:- Both the Dow Theory and Shiller are based on long term indices and both of them outperform the market
- Shiller performs better as we recover from the nightmare of the last few years
- Modern portfolio theory based on diversification and tactical asset allocation consistently outperforms the other strategies – within the measurement timeframe
labels:investment,
Symbols:VTI,SPY,IWM,BND,AGG,DBC,EEM,EFA,GSG,IYR,LQD,SHY,TLT,Bonds,Dollar/Currencies,Earnings,Economy,Hedge,Funds,
- Three Asset Class Lazy Portfolios Reviewed
09/29/2010
- Armstrong Index Based Lazy Portfolio Returns Study
09/17/2010
- How Does Your Garden Grow?
09/16/2010
- John Wasik’s Nano Portfolio Performance Scrutinized
09/14/2010
- Investing with Styles Can Pay off
07/09/2010

- ALLERGAN, INC. SAVINGS AND INVESTMENT PLAN Report On 12/03/2010
12/03/2010
This report reviews ALLERGAN, INC. SAVINGS AND INVESTMENT PLAN plan. We will discuss the investment choices and present the plan rating by MyPlanIQ. Current economic and market conditions are discussed in the context of the investment portfolios in the plan. We will then show how participants in ALLERGAN, INC. SAVINGS AND INVESTMENT PLAN can achieve reasonable investment results using asset allocation strategies.
Plan Review and Rating
ALLERGAN, INC. SAVINGS AND INVESTMENT PLAN's 401K plan consists of 13 funds. These funds enable participants to gain exposure to 3 major assets: US Equity, Foreign Equity, Fixed Income. The list of minor asset classes covered:
Foreign Large Blend: EFA, VEU, GWL, PFA
Intermediate-term Bond: AGG, CIU, BIV, BND
Large Blend: IVV, IYY, IWV, VTI, VV, SPY, DLN, RSP, SCHX
Large Growth: IVW, IWZ, JKE, VUG, ELG, QQQQ, RPG, SCHG
Large Value: IVE, IWW, JKF, VTV, ELV, PWV, RPV, SCHV
Moderate Allocation: AOM
Short Government: SHY, SHV, VGSH, PLK, USY
Small Blend: IJR, IWM, JKJ, VB, DSC, PJM, DES, SAA, UWM, SCHA
Small Growth: IJT, IWO, JKK, VBK, DSG, PWT, RZG, UKK
Small Value: IJS, IWN, JKL, VBR, DSV, PWY, RZV, UVT
World Stock: IOO, VT
As of Dec 2, 2010, this plan investment choice is rated as based on MyPlanIQ Plan Rating methodology that measures the effectiveness of a plan's available investment funds. It has the following detailed ratings:
Diversification -- Rated as (21%)
Fund Quality -- Rated as (16%)
Portfolio Building -- Rated as (31%)
Overall Rating: (24%)Current Economic and Market Conditions
We have experienced an uncertain 2010: plenty of worries on whether the US economy will climb out of the great recession and recover.
- The Federal Reserve embarked on Quantitative Easing II (QE2) to stimulate the economy.
- The housing market is still at its low but largely stabilized.
- The unemployment rate is stuck at 9%.
Americans continue to face an uncertain future, given (among others) the high unemployment rate, large federal and local government debts and global trade imbalance. With such an economic backdrop, the stock and debt markets are going to be volatile. Despite this, markets have been resilient and appear positioned to rebound.
In this market it is even more critical to properly diversify and respond market changes. MyPlanIQ offers two asset allocation strategies: strategic and tactical asset allocation strategies ( SAA and TAA for participants in ALLERGAN, INC. SAVINGS AND INVESTMENT PLAN).
Strategic Asset Allocation is based on well known modern portfolio theory and its key features include: diversification, proper fund selection and periodically re-balancing.
Tactical Asset Allocation works on a diversified array of assets provided by funds in a plan and adjusts asset mixes based on market conditions such as asset price momentum utilized by TAA.
Portfolio Discussions
The chart and table below show the historical performance of moderate model portfolios employing strategic and tactical asset allocation strategies. For comparison purpose, we also include the moderate model portfolios of a typical 3 asset SIB (Simpler Is Better) plan . This SIB plan has the following candidate index funds and their ETFs equivalent:
US Equity: (SPY or VTI)
Foreign Equity: (EFA or VEU)
Fixed Income: (AGG or BND)
Performance chart (as of Dec 2, 2010)Performance table (as of Dec 2, 2010)
Portfolio Name 1Yr AR 1Yr Sharpe 3Yr AR 3Yr Sharpe 5Yr AR 5Yr Sharpe ALLERGAN, INC. SAVINGS AND INVESTMENT PLAN Tactical Asset Allocation Moderate 7% 61% 6% 65% 7% 69% ALLERGAN, INC. SAVINGS AND INVESTMENT PLAN Strategic Asset Allocation Moderate 12% 118% 2% 8% 5% 29% Three Core Asset ETF Index Funds Tactical Asset Allocation Moderate -4% -35% 1% 9% 4% 27% Three Core Asset ETF Index Funds Strategic Asset Allocation Moderate 9% 60% -0% -3% 4% 13% Currently, asset classes in US Equity (SPY,VTI), Foreign Equity (EFA,VEU) and Fixed Income (AGG,BND) are doing relatively well. These asset classes are available to ALLERGAN, INC. SAVINGS AND INVESTMENT PLAN participants.
To summarize, ALLERGAN, INC. SAVINGS AND INVESTMENT PLAN plan participants can achieve reasonable investment returns by adopting asset allocation strategies that are tailored to their risk profiles.
Symbols: AGN , SPY , VTI , EFA , VEU , AGG , BND , AOM , CIU , BIV , GWL , PFA , IVE , IWW , JKF , VTV , ELV , PWV , RPV , SCHV , IVV , IYY , IWV , VV , DLN , RSP , SCHX , IOO , VT , SHY , SHV , VGSH , PLK , USY , IVW , IWZ , JKE , VUG , ELG , QQQQ , RPG , SCHG , IJS , IWN , JKL , VBR , DSV , PWY , RZV , UVT , IJR , IWM , JKJ , VB , DSC , PJM , DES , SAA , UWM , SCHA , IJT , IWO , JKK , VBK , DSG , PWT , RZG , UKK
- Apartment Investment and Management Company 401(k) Retirement Plan Report On 12/03/2010
12/03/2010
- ASSURANT 401(k) PLAN A&PLAN B Report On 12/03/2010
12/03/2010
- Apache Design Solutions 401K Report On 12/03/2010
12/03/2010
- AMERICAN EXPRESS RETIREMENT SAVINGS PLAN Report On 12/03/2010
12/03/2010
- ALLEGHENY ENERGY EMPLOYEE STOCK OWNERSHIP AND SAVINGS PLAN Report On 12/03/2010
12/03/2010
- BAKER 401(k) PLAN Report On 12/03/2010
12/03/2010
- BRISTOL-MYERS SQUIBB COMPANY SAVINGS AND INVESTMENT PROGRAM Report On 12/03/2010
12/03/2010
- Peabody Investments Corp.Employee Retirement Account Report On 12/03/2010
12/03/2010
- Capital Accumulation Plan of The Chubb Corporation Report On 12/03/2010
12/03/2010
- CABOT OIL & GAS CORPORATION SAVINGS INVESTMENT PLAN Report On 12/03/2010
12/03/2010
- CVS CAREMARK CORPORATION AND AFFILIATED COMPANIES Report On 12/03/2010
12/03/2010
- EQT CORPORATION SAVINGS AND PROTECTION PLAN Report On 12/03/2010
12/03/2010
- Vanguard Variable Annuity Report On 12/06/2010
12/06/2010
- TD Ameritrade Commission Free ETFs Report On 12/07/2010
12/07/2010
- Tiffany Co. Employee Profit Sharing and Retirement Savings Plan Report On 03/21/2011
03/21/2011
- Sprint Nextel 401K Plan Report On 03/21/2011
03/21/2011