MyPlanIQ Composite Allocation Indicator: White Paper
Overview
It’s been well observed and researched that major asset classes, such as stocks and bonds, exhibit strong price trends — i.e., the price of a major asset such as U.S. stocks collectively can continue to go up or down once a major uptrend or downtrend is established. Not to be confused with individual stock momentum or short-term timing (such as daily movements), this phenomenon has been discussed and shown to exist for a long time.
Long Term Moving Average Timing
Jeremy Siegel is perhaps one of the most famous researchers on this topic. His analysis of the 200-day simple moving average (SMA) as a market timing tool is detailed in his book Stocks for the Long Run. Siegel tested this strategy using data from 1886 to 2006, focusing on the Dow Jones Industrial Average (DJIA). His approach involved buying the DJIA when it closed at least 1% above its 200-day moving average and selling when it closed at least 1% below. This 1% buffer was implemented to reduce the number of trades and minimize the impact of short-term market fluctuations. He found that the strategy could effectively avoid large interim drawdowns while achieving comparable returns as the simple buy and hold DJIA strategy: The timing strategy yielded an annualized return of 9.73%, compared to 9.39% for a buy-and-hold approach. After accounting for transaction costs, the timing strategy’s return decreased to 8.11%. We want to point out that the transaction cost is no longer a major factor these days because of commission free ETF trading and high liquidity.
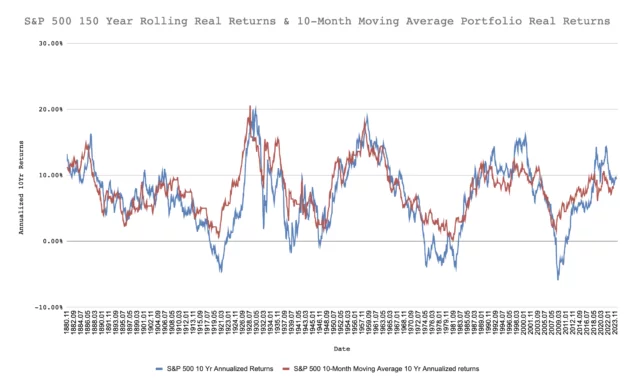
Our independent study on S&P 500 from 1871 to 2015 also confirms the effectiveness of the moving average strategy: The annualized real return from 1871 of the 10-Month moving average based portfolio for the S&P 500 is 7.9%, approximately 1% higher than the S&P 500’s annualized real returns over the same period.
The following shows the 10-year rolling return charts for both the moving average portfolio and the S&P 500:
However, the simple moving average can still misfire too frequently. That’s why we developed our own Composite Asset Allocation Indicator.
Economic Indicators
MyPlanIQ Composite Allocation Indicator is based on the belief that one can improve the simple price trend based timing strategy by incorporating some important economic indicators. The economic indicators, most of them are lagging indicators as it just takes time for the economy activities to reflect the underlying major trends such as recessions. Furthermore, it also take time to collect these data. So economic indicators, used as stand alone, aren’t good enough to predict financial markets (stocks and bonds) movement.
Nevertheless, used in combination with main financial market trends, the strategy could be improved.
The economic indicators used cover employment, consumer consumption, industrial output, housing activity, and inflation, all of which pinpoint major economic movements.
MyPlanIQ Composite Asset Allocation Indicator
Combining the ensemble of the indicators we choose with long term price trend scores on major assets such as US stocks, our composite indicator has improved the effectiveness of predicting or reacting to early financial market downturns. The indicator is a monthly signal, meaning it changes value only once per month.
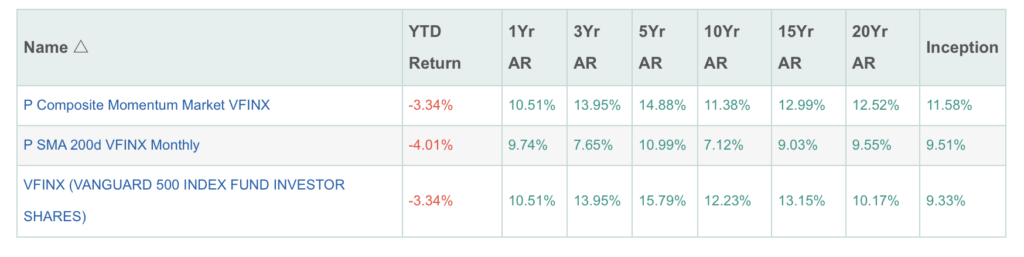
Here are the results showing how our composite indicator has improved upon the standard 200-day moving average strategy applied to the S&P 500 (VFINX – Vanguard 500 Index Fund).
From 1/13/1997 to 5/8/2025:
And the 10-Year Rolling Returns charts clearing show that the Composite Signal Based P Composite Momentum Market VFINX has consistently ourperformed the standard 200-day moving average portfolio and the buy-and-hold VFINX (S&P 500 index fund):
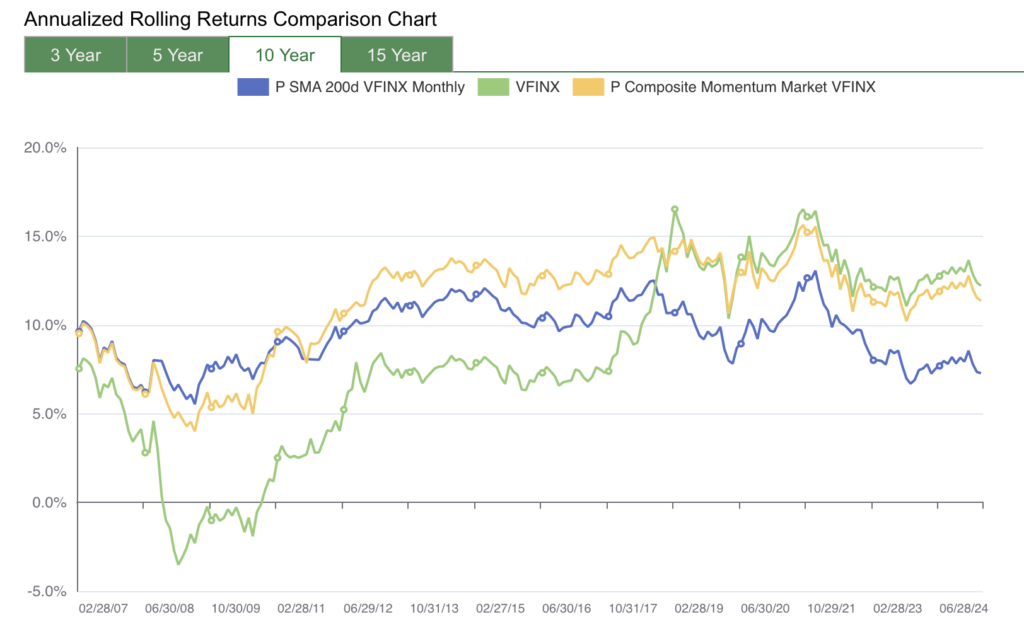
See this link for the up to date comparison.
Application of The Composite Allocation Indicator
Every month, the composite allocation indicator will be updated and its latest status shown on a subscriber’s dashboard as follows. Furthermore, all paid subscribers receive monthly transaction emails on this indicator. A typical status of the indicator status is shown like this:

The indicator can be used as an overlay on top of an existing portfolio or any mutual fund setup, depending on the context. For instance, it can be applied directly to a single index fund, such as the S&P 500 fund VFINX, to provide an additional tactical layer. It could also be used with a predefined allocation model, like a lazy portfolio or custom portfolios, or even something more hands-off, like a balanced fund such as VSMGX or a target date fund, often adopted by 401(k) participants (see 401(k) Investors). The idea here is not to replace the underlying strategy, but to complement it—adding a layer of protection while still respecting the original core allocation. When the indicator is in GROWTH mode, the portfolio retains the original holdings. Otherwise, it switches to bonds or cash when the indicator status is in SAFE mode.
The following table compares a portfolio with the indicator overlaid on VSMGX (VANGUARD LIFESTRATEGY MODERATE GROWTH FUND INVESTOR SHARES)
| Name | Maximum Drawdown | 1Yr AR | 3Yr AR | 5Yr AR | 10Yr AR | 15Yr AR | 20Yr AR | Inception |
|---|---|---|---|---|---|---|---|---|
| P Composite Allocation Indicator on VSMGX | 22% | 10.91% | 7.97% | 7.57% | 5.67% | 7.05% | 7.45% | 8.03% |
| VSMGX (VANGUARD LIFESTRATEGY MODERATE GROWTH FUND INVESTOR SHARES) | 41% | 10.88% | 7.96% | 7.56% | 6.17% | 7.29% | 6.06% | 6.77% |
Data as of 05/30/2025, AR inception is 01/01/1997
P Composite Allocation Indicator on VSMGX simply switches to CASH when the indicator is in SAFE mode. The improvement is substantial: 1.2% excessive annual returns while reducing the maximum drawdown over almost half since 1997!
The 10-year rolling return clearly shows the consistent outperformance over time, as well as the smoothness of the return path itself
In addition to viewing the potential risk reduction from an existing balanced fund or portfolio, one can also consider increasing stock (or risk asset) allocations to boost returns. This is because the overall risk of the overlaid portfolio has been reduced. In other words, you can afford to allocate more to stocks in order to bring the portfolio back to your original target risk level. A general rule of thumb here is to increase stock allocation by around 10% or so. However, for conservative investors, it’s certainly better to just stay put.
The indicator is also used in MyPlanIQ’s Tactical Asset Allocation Strategy.
However, we want to caution and remind our readers that any indicator—no matter how well it has performed historically, how thoroughly it’s been studied, or how convincing the backtest might look—will inevitably have misfires. This is simply a fact. There will be periods when the indicator gives false signals, lags too much, or reacts poorly to sudden market shifts. No model or signal can fully escape the randomness and noise that exists in real-world markets. So while it can be a useful tool within a broader strategy, it should never be treated as foolproof or relied on blindly without careful studies.