Using Shiller's CAPE Index to Trigger ETF Asset Movement
12/03/2010 0 comments
In a previous article we looked at Yale Professor Robert Shiller's Cyclically Adjusted Price Earning’ ratio (CAPE10). CAPE10 is defined as the ratio of price to the average of last 10 year trailing S&P 500 annual earnings.
This ratio can be tracked and can be used as a signal to drive selection of assets.
We will take two examples of how the signal can be used.
We create five regions based on the ratio f the current CAPE10 to the long term average CAPE10:
- Significantly Overvalued (SO): such as if the ratio >= 150%
- Modestly Overvalued (MO): such as if 117% <= ratio < 150%
- Fairly Valued (FV): such as if 83% <= ratio < 117%
- Modestly Undervalued (MU): such as if 67% <= ratio < 83%
- Significantly Undervalued (SU): such as if ratio < 67%
At each rebalancing period (such as weekly or monthly), the we select two sets of actions -- different strategies -- that drive asset movement:
- Mixed stock and cash assets
- SO: 0% in stock, 100% in cash.
- MO: 25% in stock, 75% in cash.
- FV: 50% in stock, 50% in cash
- MU: 75% in stock, 25% in cash
- SU: 100% in stock, 0% in cash
- Either stock or cash assets
- SO: 100% in cash.
- MO: 100% in cash.
- FV: 100% in cash.
- MU: 100% in stock
- SU: 100% in stock
In this case the stock market exposure is through Wilshire 5000 total return index (^DWC). This could easily be replaced with and ETF such as VTI -- we use DWC to give a long history.
Of course the trigger points and asset splits can be adjusted -- limited thought has gone into the regions. We can allow the results to provide insight into the effectiveness of this approach.
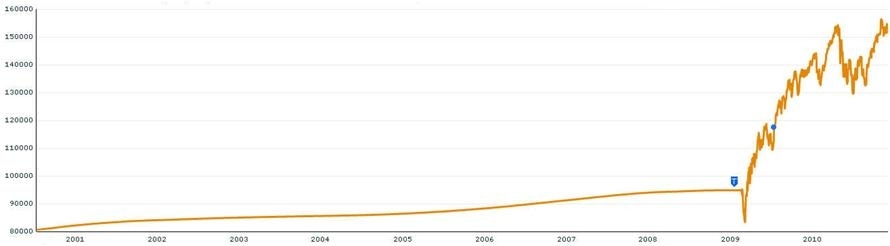
Stock OR Cash
Stock AND Cash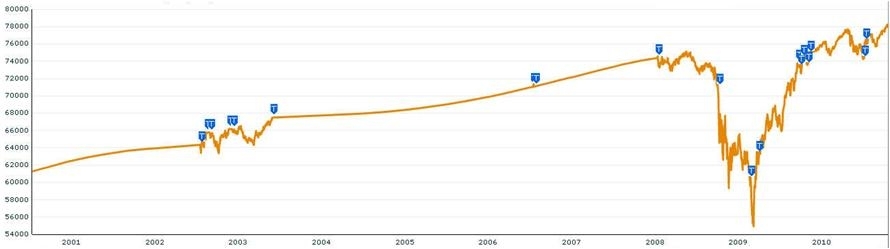
Portfolio Performance Comparison
| Portfolio Name | 1Yr AR | 1Yr Sharpe | 3Yr AR | 3Yr Sharpe | 5Yr AR | 5Yr Sharpe |
|---|---|---|---|---|---|---|
| Shiller Stock OR Cash | 12% | 65% | 18% | 101% | 12% | 77% |
| Shiller Stock and Cash | 5% | 87% | 2% | 12% | 2% | 9% |
The results show the more aggressive approach (all stock or all cash) delivers higher returns but is more volatile.
Also there are fewer transactions with the more aggressive approach which makes it easier to manage.
Probably the ideal is somewhere between these two approaches.
This is a very simple method of creating triggers to move assets.
In the next article we will look at other luminaries measures to create a strategy and compare the results.
labels:investment,
Symbols:SPY,QQQQ,IWM,MDY,EFA,VEU,EEM,VWO,IYR,ICF,VNQ,GSG,DBC,DBA,USO,LQD,CSJ,CIU,HYG,JNK,PHB,TLT,IEF,SHY,SHV,BND,AGG,MUB,MBB,VTI,
comments 0
Or Start FREE 30-day trial now >>
