|
Vanguard ETF: |  |
7.4%* |
|
Diversified Core: | |
8.1%* |
|
Six Core Asset ETFs: | |
7.3%* |
Articles on MBB
- Smart Money Going to Equities
11/23/2010
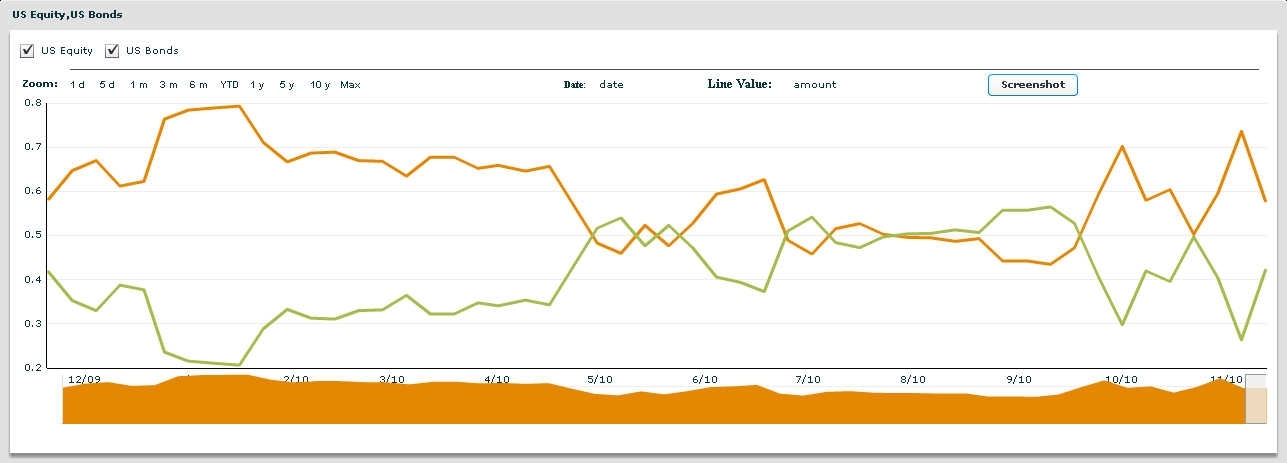
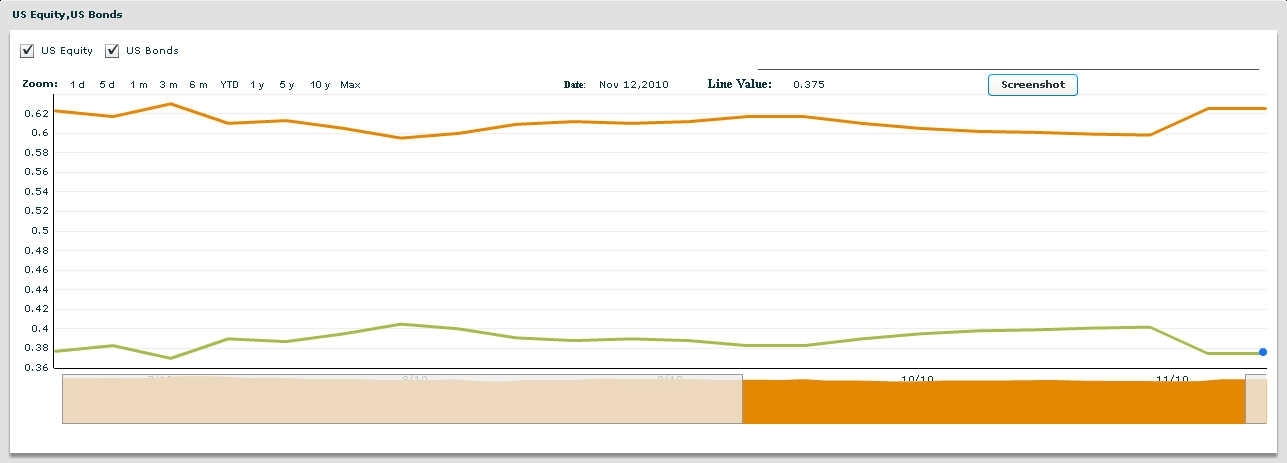
Monitoring where moderate allocation funds are putting their money gives an indication of whether fund managers are being more conservative or aggressive this week.
We track two separate indicators:- Top 3 Moderate Allocation Funds
- Aggregation of all Moderate Allocation Funds
This is calculated weekly and covers the last one year
 We can see some big variations over the past year and considerable recent volatility. We can see the impact of QE2 driving equities up and then the weakness towards the end of the weak as most indices fell and there would be a more defensive move to fixed income assets.
At this point, the balance is marginally defensive.

The aggregate group is not reacting to the changes -- the moderate portfolios have become slightly more aggressive. This may change if the current sentiment continues.labels; investment
Symbols:SPY,QQQQ,IWM,MDY,EFA,VEU,EEM,VWO,IYR,ICF,VNQ,GSG,DBC,DBA,USO,LQD,CSJ,CIU,HYG,JNK,PHB,TLT,IEF,SHY,SHV,BND,AGG,MUB,MBB,
- US Sectors Up Across the Board
11/23/2010
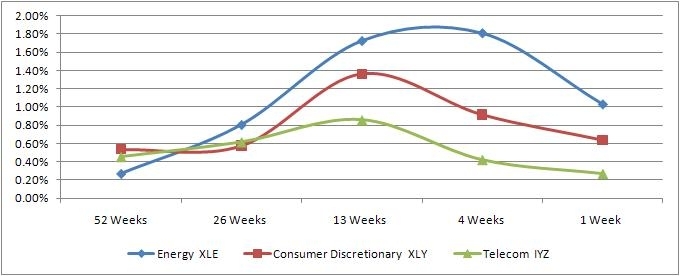
US sectors provide insight into the parts of the US economy that are flourishing or floundering. We are tracking the ETF's that represent ten different financial sectors.
More details are available on the MyPlanIQ website.Description
Symbol
Nov 22 Trend Score
Direction
Nov 15 Trend Score
Energy
XLE
13.12%
^
10.06%
Consumer Discretionary
XLY
12.95%
^
11.04%
Telecom
IYZ
10.57%
^
9.77%
Industries
XLI
10.05%
^
6.94%
Materials
XLB
9.88%
^
9.14%
Technology
XLK
8.46%
^
6.92%
Consumer Staples
XLP
5.68%
^
4.74%
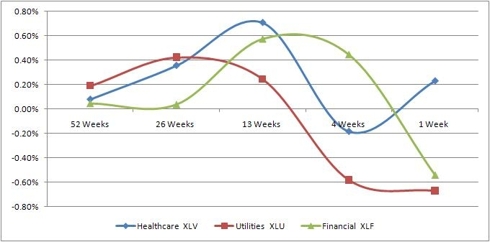
Healthcare
XLV
4.42%
^
3.16%
Utilities
XLU
4.24%
^
3.26%
Financial
XLF
2.40%
^
1.24%
COMMENT
Top Three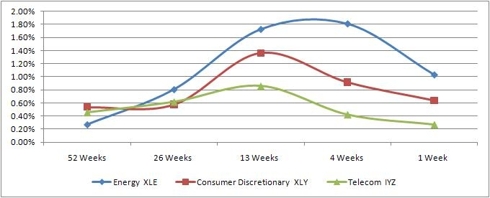
COMMENT
Bottom Three
COMMENT
CONCLUSIONlabels:investment,
Symbols:XLY,IYZ,XLI,XLB,XLK,XLE,XLF,XLP,XLU,XLV,SPY,QQQQ,IWM,MDY,EFA,VEU,EEM,VWO,IYR,ICF,VNQ,GSG,DBC,DBA,USO,LQD,CSJ,CIU,HYG,JNK,PHB,TLT,IEF,SHY,SHV,BND,AGG,MUB,MBB,
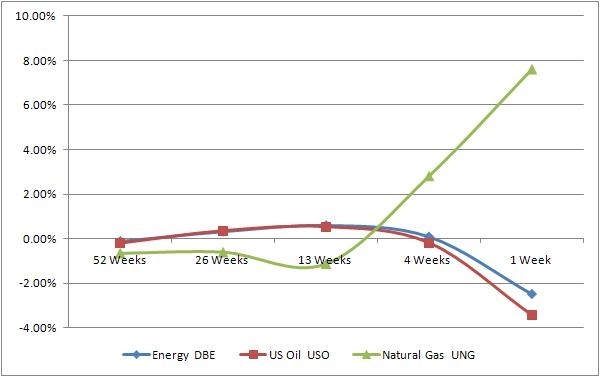
- Commodities Mixed -- Some up, Some down
11/23/2010
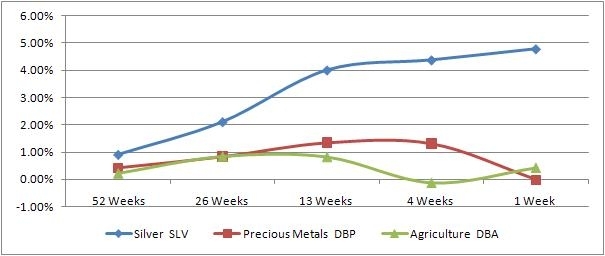
Commodities will play an increasingly important role as we climb out of the recent market mayhem and inflation becomes a reality. MyPlanIQ tracks detailed weekly commodity trend movement.
COMMENTDescription
Symbol
Nov 22 Trend Score
Direction
Nov 15 Trend Score
Silver
SLV
35.14%
^
26.46%
Precious Metals
DBP
13.24%
^
11.91%
Agriculture
DBA
8.69%
^
8.44%
Gold
GLD
8.55%
v
8.70%
Commodity
DBC
4.81%
v
5.52%
Base Metals
DBB
3.80%
v
8.54%
Energy
DBE
1.68%
^
1.67%
US Oil
USO
0.24%
v
1.12%
Natural Gas
UNG
-9.10%
^
-19.17%
COMMENT
Top 3
Bottom Three
COMMENT
CONCLUSIONlabels:investment,
Symbols:SLV,DBP,GLD,DBB,DBA,DBC,DBE,USO,UNG,SPY,QQQQ,IWM,MDY,EFA,VEU,EEM,VWO,IYR,ICF,VNQ,GSG,LQD,CSJ,CIU,HYG,JNK,PHB,TLT,IEF,SHY,SHV,BND,AGG,MUB,MBB,
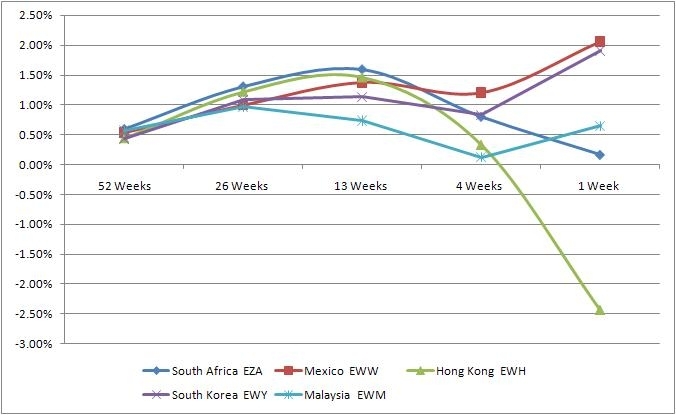
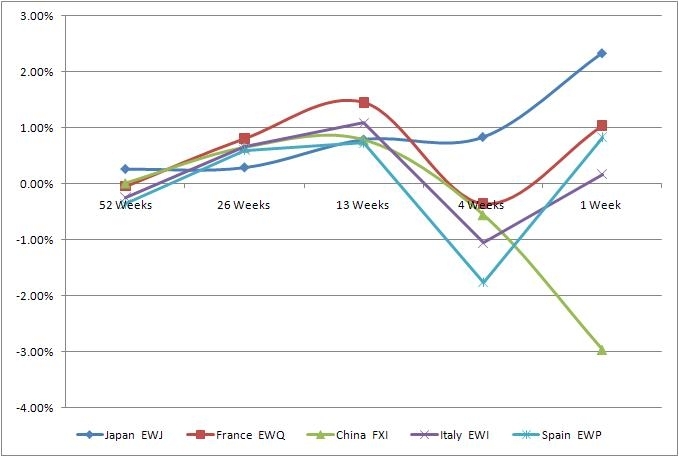
- Most Countries Rebound Some Do Not
11/23/2010
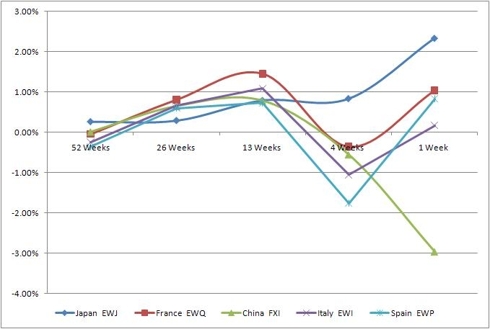
MyPlanIQ tracks detailed weekly country economic trend movement. We use ETFs that represent each geographic region and present the results here.
This is the second week of coverage and with QE2 and G20 meetings behind us. Each sovereign nation will deal with their own challenges as they react changes on the international stage.
More details are available on the MyPlanIQ website.
The largest industrial nations are meeting in Seoul this week and one of the topics on the agenda is rebalancing global growth.Description
Symbol
Nov 22 Trend Score
Direction
Nov 15 Trend Score
South Africa
EZA
18%
^
14%
Mexico
EWW
16%
^
12%
Hong Kong
EWH
14%
v
16%
South Korea
EWY
14%
^
10%
Malaysia
EWM
13%
^
11%
Singapore
EWS
13%
^
13%
Germany
EWG
12%
^
8%
Taiwan
EWT
11%
^
8%
Australia
EWA
11%
^
7%
Russia
RSX
10%
^
7%
Canada
EWC
10%
^
7%
India
INP
9%
v
12%
Austria
EWO
9%
^
5%
Brazil
EWZ
9%
^
5%
Switzerland
EWL
9%
^
6%
United Kingdom
EWU
9%
^
8%
Belgium
EWK
8%
^
5%
The Netherlands
EWN
8%
^
4%
Japan
EWJ
7%
^
4%
France
EWQ
7%
^
4%
China
FXI
5%
v
6%
Italy
EWI
3%
^
1%
Spain
EWP
0%
^
-1%
COMMENT
Top Five

COMMENT
Bottom Five
COMMENT
CONCLUSION
labels:investment,
Symbols:INP,EZA,EWS,EWH,EWW,EWM,EWY,RSX,EWA,EWT,EWC,EWZ,EWL,EWG,EWU,FXI,EWK,EWN,EWJ,EWQ,EWO,EWI,EWP,SPY,QQQQ,IWM,MDY,EFA,VEU,EEM,VWO,IYR,ICF,VNQ,GSG,DBC,DBA,USO,LQD,CSJ,CIU,HYG,JNK,PHB,TLT,IEF,SHY,SHV,BND,AGG,MUB,MBB,
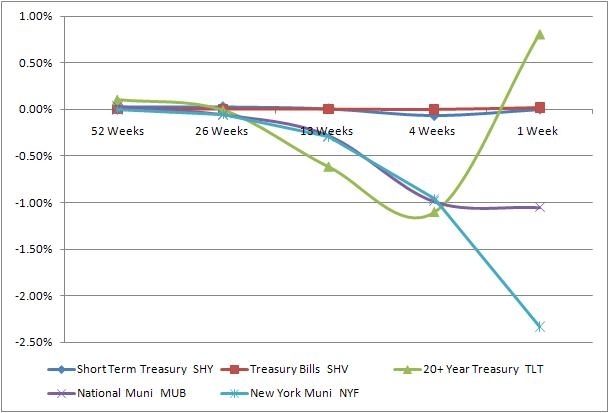
- ETF Based Bond Trend Indicators For The Week of November 22
11/23/2010
Fixed income indices provide important insight into debt market conditions that are key to asset allocation strategies. We track detailed weekly bond trend movements. We use ETFs that represent the bond classes.
Last week, we noted that practically all bond assets other than short term credit and treasury bills had dramatic drop. This week, drops continue but at a much lower level. This continues to flag that there remains an appetite for risk based assets.
Description
Symbol
22-Nov Trend Score
Direction
15-Nov Trend Score
High Yield
(JNK)
6%
^
5%
International Inflation Protected
(WIP)
4%
v
4%
Emerging Mkt Bonds
(PCY)
4%
v
5%
Long Term Credit
(LQD)
3%
v
3%
Intermediate Treasury
(IEF)
2%
v
3%
Intermediate Term Credit
(CIU)
2%
v
3%
International Treasury
(BWX)
2%
v
3%
Inflation Protected
(TIP)
2%
v
2%
MBS Bond
(MBB)
2%
^
1%
10-20Year Treasury
(TLH)
1%
v
2%
Short Term Credit
(CSJ)
1%
^
1%
US Total Bond
(BND)
1%
v
1%
Short Term Treasury
(SHY)
0%
v
0%
Treasury Bills
(SHV)
0%
^
0%
20+ Year Treasury
(TLT)
-1%
v
-1%
National Muni
(MUB)
-2%
v
-1%
New York Muni
(NYF)
-2%
v
0%
California Muni
(CMF)
-3%
v
-1%
Top Five Indicators
click to enlarge
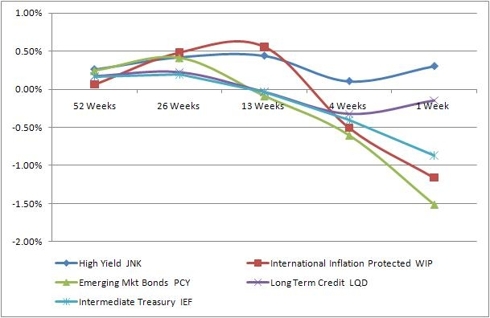
High yield bonds having an upward trend supports the appetite for more risk based assets.
LQD is one to watch to see whether it continues its upward trend and PCY to see whether Emerging market debt turns positive as an emerging market.
Bottom Five Indicators
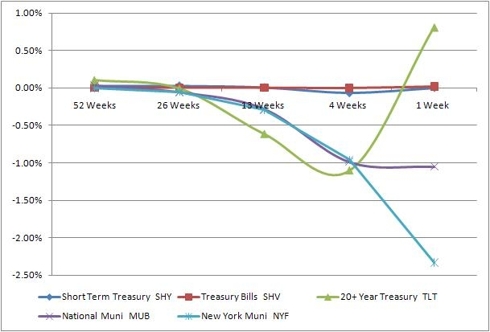
As the Federal Reserve kicked off a program (QE2) to buy $600 billion in government debt within the next eight months, we have seen a flattening yield curve - a sharp drop in the prices of short-term government bonds and declining yields for the long maturity government bonds. This indicates that the demand for short term safe-haven U.S. government bonds also receded as concern over the solvency of Ireland’s banking system eased.
The renewed concern over state and local government finances has also driven up the yields on Munis. Investors are waiting for a stronger message coming out from the municipalities on how they will balance their budgets and avoid a potential default.
In conclusion, the long maturity government bonds have found a comfort level in the market as the Fed came out and strongly committed to the QE2 program, but the uncertainties over Ireland’s finances and China’s possible rate hike will continue to have an effect on the volatilities in the fixed income markets.
labels:investment,
Symbols:AGG,BND,BWX,CIU,CMF,CSJ,EMB,HYG,IEF,JNK,LQD,MBB,MUB,NYF,PCY,PHB,SHV,SHY,TIP,TLH,TLT,WIP,
- Commodity ETFs Show Muted Downturn This Week
11/20/2010
- Top US Sectors Weather the week well -- bottom half feels the pain
11/19/2010
- Using Morningstar's Top Bond Manager to Build a Low Stress Portfolio
11/19/2010
- Commodity Indicators for Week of November 15th
11/17/2010
- Where is the Smart Money Going
11/17/2010
- Countries All Drop -- India significantly, Japan only a little
11/16/2010
- ETF Based Major Asset Class Trend Indicators For The Week of November 15
11/15/2010
- ETF Based Bond Trend Indicators For The Week of November 15
11/15/2010
- Retirement Income Portfolio Building Using ETFs and Asset Allocation Strategies
11/12/2010
- ETFs Provide Insight Into U.S. Sectors' Performance
11/12/2010
- International ETF's Give Insight on Global Economies
11/10/2010
- ETF Based Major Asset Class Trend Indicators For The Week of November 8
11/08/2010
- Bernstein's No Brainer and Smart Money Portfolios Reviewed
10/08/2010
- Diversification, Style AND Asset Rotation Improve Portfolio Performance without Incurring Extra Risk
10/08/2010