 |
Vanguard ETF: |  |
7.4%* |
|
Diversified Core: | |
8.1%* |
|
Six Core Asset ETFs: | |
7.3%* |
Articles on IJS
- Lazy Portfolios -- The Playoffs II
10/19/2010
This is the second article as we attempt to whittle down the lazy portfolios to four finalists for great analysis of what makes for a great portfolio. We are in the bottom half of the alphabetical list and the eight are listed in reducing order asset classes and funds. We have stated that the winners should be those with the most asset classes and highest number of funds.
Portfolio Classes Funds ETF Equivalent Seven-12 7 12 Y SIX SIB SAA 6 6 y Gone Fishin' 5 10 y Swensen 6 4 6 Y Wasik`s Nano 4 5 Y Harry Browne 3 4 Y Schultheis 3 3 Y Lowell 2 8 Y We are using this series of comparisons to validate whether this proves to be true.- Craig L. Israelsen, Ph.D., is an Associate Professor at Brigham Young University. The Seven Equally Weighted, twelve fund portfolio is aimed to protect against losses.
- The MyPlanIQ six asset SIB has index funds for each of the asset classes represented and rebalances monthly – this is primarily a benchmark portfolio
- Alexander Green proposed this The Gone Fishin' Portfolio which was outlined in his book 'The Gone Fishin' Portfolio'
- David Swensen, the Yale Endowment Manager, proposed this one size fit in all model portfolio for individual investors.
- John Wasik has been a professional journalist and author for 30 years specializing in personal finance. John proposed a portfolio which employs a handful of index or ETFs
- Harry Browne is the author of Fail-Safe Investing
- Bill Schulthe is is a former Smith Barney broker and author of "The Coffeehouse Investor."
- Jim Lowell edits MarketWatch's ETF Trader, an investment letter employing a momentum-based exchange-traded-fund strategy for long-term investors.
The returns are now presented in order of highest to lowest of the five year returns. How do the returns compare to what we would have expected?
Portfolio/AR(%) 1 Yr 3 Yr 5 Yr Inception Harry Browne 12.49 7.40 8.99 7.31 Six SIB SAA 12.54 1.61 7.44 8.26 Seven-12 15.55 0.80 6.41 6.16 Swensen Six 15.10 (0.24) 6.21 7.10 Gone Fishin' 12.98 (0.34) 5.64 6.72 Wasik`s Nano 15.34 (1.93) 4.74 4.66 Schultheis 9.23 (2.28) 4.68 4.59 Lowell 12.45 (6.26) 3.55 6.74 - The portfolios roughly follow the asset class/fund class as would be expected
- The Harry Browne portfolio stands out as the clear exception to the rule – it has a signnificant lead over the other portfolios
- The six asset SIB performed well – that was expected. Six asset classes with index funds should perform well
When we look at the drawdown for each of the portfolios, it will reveal which is the most painful to own.Portfolio/DD1 Yr3 Yr5 YrInceptionHarry Browne5%15%15%15%Swensen Six8%39%39%39%Six SIB SAA8%39%39%39%Schultheis9%39%39%39%Seven-128%40%40%40%Gone Fishin'9%42%42%42%Wasik`s Nano9%44%44%44%Lowell16%57%57%57%
Again the Harry Browne portfolio is the clear winner.
We select the top two – which are the Harry Browne and Six asset SIB to move to the final round where they will be put against the best two funds from the top half of the alphabet.
Takeaways- The portfolios followed the expected path against asset classes and funds
- The Harry Browne portfolio was the clear winner and was the exception – we will find out in the final article whether it proves the rule
- With the exception of the Harry Browne portfolio, the drawdown ratios are uncomfortably high
- ETF’s can be used to implement any of these strategies
labels:investment,
Symbols:ACWI,ACWX,ADRE,AGG,BIV,BLV,BND,BSV,BWX,CFT,CIU,CSJ,DBC,DBV,DIA,DVY,EDV,EEM,EFA,EFG,EFV,EMB,ETF,GLD,GOOG,GSG,GXC,HPQ,HYG,ICF,IEF,IEI,IFGL,IGOV,IGR,IJH,IJJ,IJK,IJR,IJS,IJT,IVE,IVV,IVW,IWB,IWC,IWD,IWF,IWM,IWN,Portfolio-Building,with,ETFs,Closed-End,Funds,Commodity,ETFs,Currency,ETFs,Developed,Market,ETFs,
- Lazy Portfolios -- The Playoffs
10/19/2010
We have compared the performance of fifteen buy and hold portfolios from investing luminaries. Each of the portfolios was measured for performance against SIBs and their relative merits examined. We now move into a playoff round where we will compare the portfolios with each other and see if we can find an eventual winner and look at why they won and what we can learn from this.
When we were testing the portfolios against SIBs, we introduced a tactical asset allocation strategy which usually turned out to have the best performance. For this series of peer comparisons, we are only going to use a buy and hold strategy. When we find the eventual winner, we will then perform a final comparison with tactical asset allocation and see what we conclude.
The portfolios have been sorted alphabetically and we are going to start with the top part of the alphabet. The portfolios will be listed by decreasing number of asset classes and decreasing number of funds. We would expect that the portfolio with the greatest number of asset classes to have the highest returns and we will test that to see to what extent it is true.
Table of Lazy Portfolios and their classes and fundsPortfolio Classes Funds ETF Equivalent Fund Advice 5 11 Y Gibson 5 6 y Five SIB SAA 5 5 Y Aronson 4 11 y Armstrong 4 7 y Four SIB SAA 4 4 Y Burns/Tobias 3 3 Y - Paul Merriman's FundAdvice.com website has indexed porfolios for several fund companies. The basic strategy is the same as with all the other Lazy Portfolios, here with 11 no-load index funds
- Gibson's 5 Equal Asset Allocation Strategy comes from Roger Gibson’s widely read "Asset Allocation: Balancing Financial Risks.”
- The MyPlanIQ five asset SIB has index funds for each of the asset classes represented and rebalances monthly – this is primarily a benchmark portfolio
- Ted Aronson and his AJO Partners manage about $25 billion of institutional assets. Aronson puts his family's taxable money in this well-diversified portfolio of no-load index funds
- Frank Armstrong, author of The Informed Investor, proposed his portfolio for an MSN Money article
- The MyPlanIQ four asset SIB has index funds for each of the asset classes represented and rebalances monthly – this is primarily a benchmark portfolio
- Scott Burns has covered personal finance and investments for nearly 40 years and ranks as one of the most widely read personal finance writers in the country/ Andrew Tobias, a Harvard alum and writer of 12 books including The Only Investment Guide You'll Ever Need.
Table of Lazy Portfolios and their Annual ReturnsPortfolio/AR(%) 1 Yr 3 Yr 5 Yr Inception Five SIB SAA 14.27 1.73 7.67 8.38 Four SIB SAA 10.76 0.17 7.11 7.40 Fund Advice 10.85 0.24 6.06 6.75 Armstrong 11.69 (1.76) 5.15 5.55 Burns/Tobias 0.45 (2.32) 4.54 4.48 Aronson 8.46 (1.10) 3.48 3.59 Gibson 8.63 (4.72) 0.08 3.43 The returns are now presented in order of highest to lowest of the five year returns. How do the returns compare to what we would have expected.- There was a wider spread than expected on the four and five asset class portfolios and the Burns/Tobias three asset class, three fund portfolio performed better than expected
- A five asset class portfolio came out on top – that was expected. The fact that an index based portfolio won out it also not surprising as index funds often outperform funds with active management
- The fact that a four asset portfolio beat a five asset portfolio demonstrates that picking the right funds in an asset class is important and that index funds deliver good results
- For a very simple three asset portfolio, the Burns/Tobias performance came higher in the league table
- The most surprising result is that the Gibson portfolio performed so poorly. When breaking down the long term results of this portfolio, the selection of asset classes has given the portfolio a modest return with a low drawdown index. In the significant market downturn over the past few years, it suffered (as did most buy and hold strategies) badly and has returned to its modest gains whereas other portfolios have had a higher drawdown ratio but a faster recovery
Table of Lazy Portfolios and their Draw Down RatiosPortfolio/DD 1 Yr 3 Yr 5 Yr Inception Aronson 6% 30% 30% 30% Fund Advice 9% 38% 38% 38% Gibson 7% 38% 38% 38% Four SIB SAA 9% 40% 40% 40% Five SIB SAA 8% 41% 41% 41% Scott Burns 9% 41% 41% 41% Armstrong 11% 44% 44% 44% We list the draw down ratios for each of the portfolios and it’s clear that with the recent turbulence, all of them are higher than would be desired.We will select the top two – which are the four and five asset SIBs to move to the final round where they will be put against the best two funds from the bottom half of the alphabet.
Takeaways- Asset classes and number of funds in each class are an indicator of better returns but it’s not the only thing
- Index funds continue to show good results against managed funds
- or those investing in the very long term, looking at the draw down index is important because it will help you live with the fund selection you have made
- ETF’s can be used to implement any of these strategies
labels:investment,
Symbols:ACWI,ACWX,ADRE,AGG,BIV,BLV,BND,BSV,BWX,CFT,CIU,CSJ,DBC,DBV,DIA,DVY,EDV,EEM,EFA,EFG,EFV,EMB,ETF,GLD,GOOG,GSG,GXC,HPQ,HYG,ICF,IEF,IEI,IFGL,IGOV,IGR,IJH,IJJ,IJK,IJR,IJS,IJT,IVE,IVV,IVW,IWB,IWC,IWD,IWF,IWM,IWN,Portfolio-Building,with,ETFs,Closed-End,Funds,Commodity,ETFs,Currency,ETFs,Developed,Market,ETFs,
- Armstrong Index Based Lazy Portfolio Returns Study
09/17/2010
Frank Armstrong, author of The Informed Investor, proposed thisportfolio for an MSN Money article. The two key points of the portfolio are that it has four asset classes (US, International, REIT, Bonds) and relies on market indices rather than active management.The portfolio uses index funds because index funds eliminate manager risk. It overweights small-cap stocks as small-cap stocks have historically outperformed large caps stocks. The portfolio has a strong value tilt, based on the theory that, over the long haul, beaten-down stocks will perform better than high-flying growth stocks.
This should be a low cost, well performing portfolio.The fund selection for testing the strategy is listed below with the ETF alternatives:- 9.25% in Vanguard Small Cap Value VISVX (SCZ)
- 9.25% in Vanguard Value VIVAX (SPY, IYY)
- 6.25% in Vanguard Small-Cap Growth VISGX (VBK)
- 6.25% in Vanguard 500 Index VFINX (IVW)
- 31% in Vanguard Total International Stock VGTSX (EFA)
- 8% in Vanguard REIT VGSIX (IYR, VNQ, RWX)
- 30% in Vanguard Short-Term Bond VBISX (BND, AGG)
Things to note about the portfolio:- This is designed as a lazy portfolio with limited rebalancing specified
- With 70% in equities, this would be considered an aggressive portfolio
- REIT is possibly underweighted
We will create historical returns of this portfolio as originally planned and then compare against strategic asset allocation (annual rebalance) and tactical asset allocation. This will measure:- The impact of equal weighting of the equities – bonds will be fixed at 30% -- SAA strategy
- The impact of actively managing the equities – bonds remain fixed at 30% -- TAA strategy
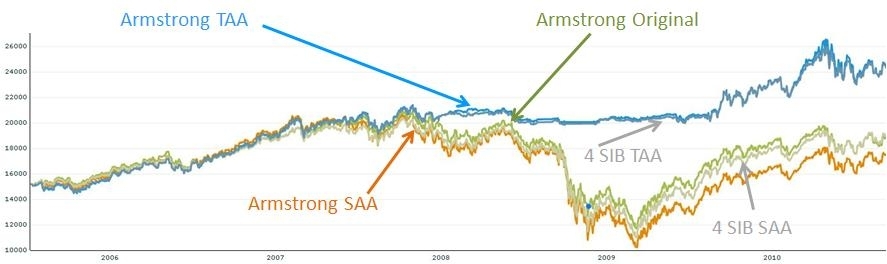
We will then introduce a four asset SIB which will give a measure of the choice of funds. The SAA and TAA strategies will give the same weights to each of the funds but use simpler asset classes funds.4 Asset SIB Breakdown with ETF alternativesLARGE BLEND VTSMX (VTI)Foreign Large Blend VGTSX (VEU)REAL ESTATE VGSIX (VNQ)Intermediate-Term Bond VBMFX (BND)The results are shown below. There are a number of interesting things to note- The closest comparison of similar strategies is the Armstrong Original versus the Armstrong SAA. The Armstrong original outperforms SAA which says that overloading the US stocks towards small value is successful
- All of the buy and hold strategies suffer from the “downturn dip” and the tactical asset allocation strategies perform much better
- The difference between the two TAA strategies is negligible
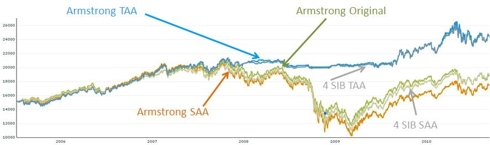
Annual Returns 1 Year 3 Years 5 Years Original 8.83 -0.88 4.27 Armstrong SAA 13.91 -2.60 2.96 Armstrong TAA 12.71 7.30 10.43 4 SIB SAA 14.12 0.25 4.59 4 SIB TAA 12.32 7.15 10.21
Takeaways:- The Armstrong portfolio is a well constructed set of diversified assets based on market indices
- To reduce volatility in today’s economy, it might make sense to add commodities and emerging market equities
- The biggest impact on returns is moving to a tactical asset allocation strategy
- The SIB portfolios which can easily be executed with ETF’s perform very well and will be low cost
labels:investment,
Symbols:DIA,IYY,VTI,DVY,ONEQ,QCLN,QABA,PWC,VTV,VUG,IWM,IWO,IWW,MDY,IJJ,IJK,VO,AGG,BND,SHY,VBK,IJS,VBR,IWP,IWS,VEA,EFG,EFV,VWO,VEU,SCZ,SPY,IYR,IVW,RWX,EFA,VNQ,Tactical,Asset,Allocation,asset,allocation,armstong,ideal,index,strategic,asset,allocation,
- How Does Your Garden Grow?
09/16/2010
Jim Lowell edits MarketWatch's ETF Trader, an investment letter employing a momentum-based exchange-traded-fund strategy for long-term investors. Large/small stocks, proposed his Sower's Growth Portfolio. This is a diversified portfolio of exchange-traded funds. The view is that a growing economy tends to create a growing portfolio.This portfolio is heavily equity and US focused. It is a diversified portfolio of exchange-traded funds including Big-caps ETF (DIAIYYONEQ PWC), Midcaps ETF(MDY), Small-caps ETF (IWM) and foreign ETF(EFA).The fund selection for testing the strategy is listed below with the ETF alternatives:
US Equities- 10% in Diamonds Trust DIA (SPY)
- 15% in iShares DJ U.S. Total Market IYY (VTI, DVY)
- 7.5% in Fidelity NASDAQ Composite ONEQ (QCLN, QABA)
- 7.5% in Power Shares Dynamic Market PWC (VTV, VUG)
- 10% in iShares Russell 2000 IWM (IWO, IWW)
- 15% in Mid Cap SPDR Trust MDY (IJJ, VO)
International Equities
- 25% in iShares MSCI International EAFE EFA (VEA, EFV)
- 10% in iShares MSCI Emerging Markets EEM (VWO)
Things to note about the portfolio:- 100% in equities is an aggressive portfolio
- 65% in US equities is high in today’s market environment
- There is no real estate (IYR, VNQ, ICF) or fixed income which would likely result in improved performance today
- With three asset classes (US, international and emerging markets), this can be mapped against a 3 asset class SIB
We will make a comparison of the performance of this portfolio against strategic asset allocation (equally spread assets), tactical asset allocation and against 3 asset class SIB portfolios we discussed in a previous article,The 3 asset class SIB breakdown- Large Blend VTSMX (ETF VTI)
- Foreign Large Blend VGTSX (ETF VEU)
- Intermediate-Term Bond VBMFX (ETF BND)
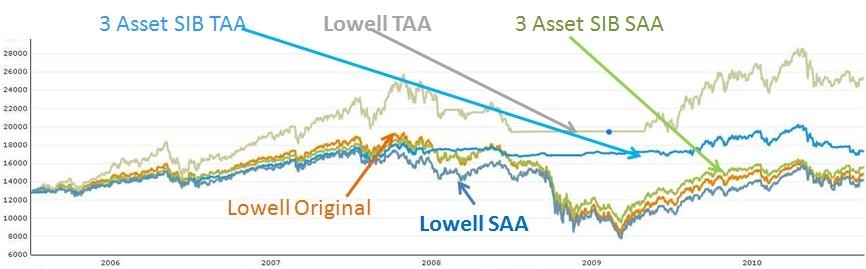
There are a number things to note about the comparisons:- The Lowell SAA and TAA were driven with a 100% in equities -- the TAA strategy will move to fixed income (cash) should the momentum drive it that way, the SAA strategy will not
- The 3 asset SIBs are using an aggressive model portfolio that still includes some fixed income
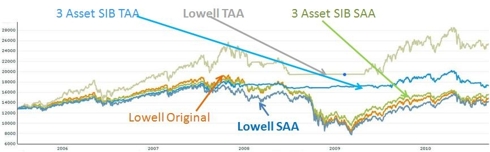
Summary Returns of Lowell's Portfolios Annual Returns 1 year 3 Year 5 Year Lowell Original 9.04 -5.38 2.25 Lowell SAA 13.14 -13.6 1.83 Lowell TAA 6.23 5.26 13.26 3 SIB SAA 7.03 -3.39 3.29 3 SIB TAA -4.23 0.63 5.76
The results are shown above. There are a number of interesting things to note :- The choice of funds, even if diversification enables reasonable returns
- Before the downturn, the original portfolio was outperforming everything except the dynamic allocation of the original strategy
- The strategy falls foul of the 2008/2009 downturn and tracks pretty closely with any buy and hold strategy
- The three asset SIBs have a fixed income fund that enables slightly better performance in choppier market conditions
- The Lowell choice of funds allows the tactical asset allocation strategy to outperform the three asset class SIB with TAA
- The 2008/2009 downturn shows the benefits of a tactical asset allocation – even if it means moving equities to cash
Takeaways:- The Sower’s growth portfolio is a low maintenance portfolio that is heavily weighted towards US equities. In the long term, there is still confidence in the US economy but following this portfolio and strategy will give you some heartache
- This portfolio was created when the sort of downturn we experienced in 2007/2008 was not envisioned -- it's hard to imagine that this portfolio would still be recommended today
- Migrating to a dynamic strategy with the same funds provides much higher returns. Given a dynamic strategy, it would make sense to add some fixed income such as AGG, BND, SHY, CSJ rather than just cash
- Conventional tactical asset allocation with the right number of asset classes (at least five) still provides the best performance
- ETF’s give you a good degree of choice a good vehicle for any portfolio and with increasing track record, it’s possible to demonstrate good historical performance
labels:investment,
Symbols:DIA,IYY,VTI,DVY,ONEQ,QCLN,QABA,PWC,VTV,VUG,IWM,IWO,IWW,MDY,IJJ,IJK,VO,AGG,BND,SHY,SPY,VBK,IJS,IWP,IWS,VEA,EFG,EFV,VWO,VEU,ETF,Asset,Allocation,Tactical,Asset,Allocation,
- ALLERGAN, INC. SAVINGS AND INVESTMENT PLAN Report On 12/03/2010
12/03/2010
This report reviews ALLERGAN, INC. SAVINGS AND INVESTMENT PLAN plan. We will discuss the investment choices and present the plan rating by MyPlanIQ. Current economic and market conditions are discussed in the context of the investment portfolios in the plan. We will then show how participants in ALLERGAN, INC. SAVINGS AND INVESTMENT PLAN can achieve reasonable investment results using asset allocation strategies.
Plan Review and Rating
ALLERGAN, INC. SAVINGS AND INVESTMENT PLAN's 401K plan consists of 13 funds. These funds enable participants to gain exposure to 3 major assets: US Equity, Foreign Equity, Fixed Income. The list of minor asset classes covered:
Foreign Large Blend: EFA, VEU, GWL, PFA
Intermediate-term Bond: AGG, CIU, BIV, BND
Large Blend: IVV, IYY, IWV, VTI, VV, SPY, DLN, RSP, SCHX
Large Growth: IVW, IWZ, JKE, VUG, ELG, QQQQ, RPG, SCHG
Large Value: IVE, IWW, JKF, VTV, ELV, PWV, RPV, SCHV
Moderate Allocation: AOM
Short Government: SHY, SHV, VGSH, PLK, USY
Small Blend: IJR, IWM, JKJ, VB, DSC, PJM, DES, SAA, UWM, SCHA
Small Growth: IJT, IWO, JKK, VBK, DSG, PWT, RZG, UKK
Small Value: IJS, IWN, JKL, VBR, DSV, PWY, RZV, UVT
World Stock: IOO, VT
As of Dec 2, 2010, this plan investment choice is rated as based on MyPlanIQ Plan Rating methodology that measures the effectiveness of a plan's available investment funds. It has the following detailed ratings:
Diversification -- Rated as (21%)
Fund Quality -- Rated as (16%)
Portfolio Building -- Rated as (31%)
Overall Rating: (24%)Current Economic and Market Conditions
We have experienced an uncertain 2010: plenty of worries on whether the US economy will climb out of the great recession and recover.
- The Federal Reserve embarked on Quantitative Easing II (QE2) to stimulate the economy.
- The housing market is still at its low but largely stabilized.
- The unemployment rate is stuck at 9%.
Americans continue to face an uncertain future, given (among others) the high unemployment rate, large federal and local government debts and global trade imbalance. With such an economic backdrop, the stock and debt markets are going to be volatile. Despite this, markets have been resilient and appear positioned to rebound.
In this market it is even more critical to properly diversify and respond market changes. MyPlanIQ offers two asset allocation strategies: strategic and tactical asset allocation strategies ( SAA and TAA for participants in ALLERGAN, INC. SAVINGS AND INVESTMENT PLAN).
Strategic Asset Allocation is based on well known modern portfolio theory and its key features include: diversification, proper fund selection and periodically re-balancing.
Tactical Asset Allocation works on a diversified array of assets provided by funds in a plan and adjusts asset mixes based on market conditions such as asset price momentum utilized by TAA.
Portfolio Discussions
The chart and table below show the historical performance of moderate model portfolios employing strategic and tactical asset allocation strategies. For comparison purpose, we also include the moderate model portfolios of a typical 3 asset SIB (Simpler Is Better) plan . This SIB plan has the following candidate index funds and their ETFs equivalent:
US Equity: (SPY or VTI)
Foreign Equity: (EFA or VEU)
Fixed Income: (AGG or BND)
Performance chart (as of Dec 2, 2010)Performance table (as of Dec 2, 2010)
Portfolio Name 1Yr AR 1Yr Sharpe 3Yr AR 3Yr Sharpe 5Yr AR 5Yr Sharpe ALLERGAN, INC. SAVINGS AND INVESTMENT PLAN Tactical Asset Allocation Moderate 7% 61% 6% 65% 7% 69% ALLERGAN, INC. SAVINGS AND INVESTMENT PLAN Strategic Asset Allocation Moderate 12% 118% 2% 8% 5% 29% Three Core Asset ETF Index Funds Tactical Asset Allocation Moderate -4% -35% 1% 9% 4% 27% Three Core Asset ETF Index Funds Strategic Asset Allocation Moderate 9% 60% -0% -3% 4% 13% Currently, asset classes in US Equity (SPY,VTI), Foreign Equity (EFA,VEU) and Fixed Income (AGG,BND) are doing relatively well. These asset classes are available to ALLERGAN, INC. SAVINGS AND INVESTMENT PLAN participants.
To summarize, ALLERGAN, INC. SAVINGS AND INVESTMENT PLAN plan participants can achieve reasonable investment returns by adopting asset allocation strategies that are tailored to their risk profiles.
Symbols: AGN , SPY , VTI , EFA , VEU , AGG , BND , AOM , CIU , BIV , GWL , PFA , IVE , IWW , JKF , VTV , ELV , PWV , RPV , SCHV , IVV , IYY , IWV , VV , DLN , RSP , SCHX , IOO , VT , SHY , SHV , VGSH , PLK , USY , IVW , IWZ , JKE , VUG , ELG , QQQQ , RPG , SCHG , IJS , IWN , JKL , VBR , DSV , PWY , RZV , UVT , IJR , IWM , JKJ , VB , DSC , PJM , DES , SAA , UWM , SCHA , IJT , IWO , JKK , VBK , DSG , PWT , RZG , UKK
- Apartment Investment and Management Company 401(k) Retirement Plan Report On 12/03/2010
12/03/2010
- Abercrombie Fitch Co. Savings and Retirement Plan Report On 12/03/2010
12/03/2010
- Apache Design Solutions 401K Report On 12/03/2010
12/03/2010
- CABOT OIL & GAS CORPORATION SAVINGS INVESTMENT PLAN Report On 12/03/2010
12/03/2010
- TD Ameritrade Commission Free ETFs Report On 12/07/2010
12/07/2010
- Qualcomm 401(k) Plan Report On 12/07/2010
12/07/2010
- Sprint Nextel 401K Plan Report On 03/21/2011
03/21/2011