 |
Vanguard ETF: |  |
7.4%* |
|
Diversified Core: | |
8.1%* |
|
Six Core Asset ETFs: | |
7.3%* |
Articles on VNQ
- ETF Based Major Asset Class Trend Indicators For The Week of November 8
11/08/2010
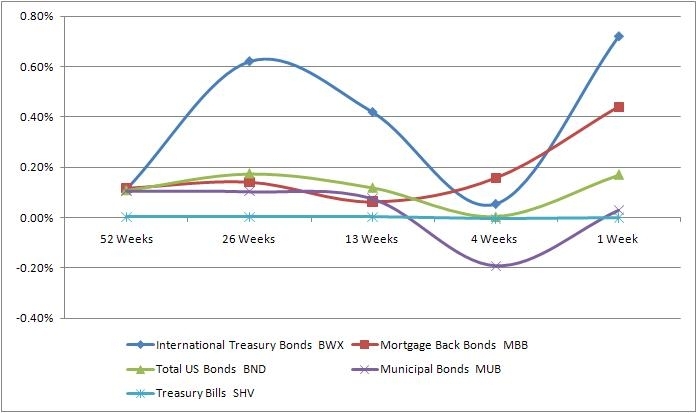
MyPlanIQ tracks major asset classes trend movement. Major asset trends provide insights into underlying economic and market segments and are critical to tactical asset allocation strategies. We use ETFs that represent the asset class indices. For more information, please visitMyPlanIQ 360 Degree Market View.
The Fed announced $600 billion treasury purchase, the so called QE2 that pushed most risk assets price higher. Risk assets like emerging market stocks, foreign stocks, US stocks, REITs and commodities had risen higher even before the announcement, partly due to QE2 anticipation and partly due to perceived improved economic conditions.
It is also believed that QE2 will result in US dollar devaluation and that in turns has led so called ‘commodity stockpiling’ propelling Gold and other commodities (such as agricultural commodities) to continue their recent ascent.
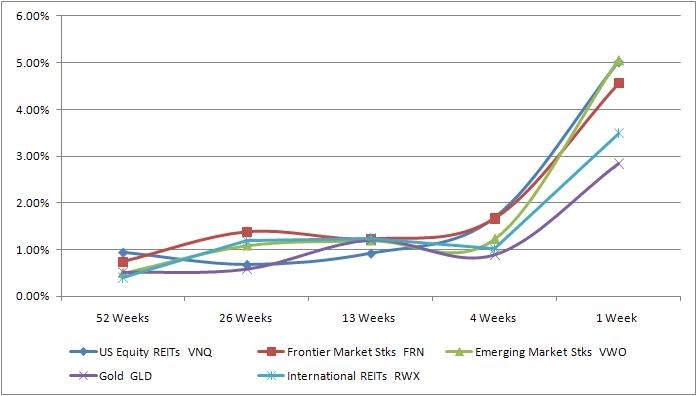
The only major trend change worth watching is the prices of long term treasury bonds, especially 10+ years which have continued weakness. It illustrates the market's belief that in the longer term, the Fed's actions will result in higher inflation.Asset Class Symbol 8-Nov Trend Score Direction US Equity REITs VNQ 57% ^ Frontier Market Stks FRN 47% ^ Emerging Market Stks VWO 34% ^ Gold GLD 32% v International REITs RWX 28% ^ US Stocks VTI 25% ^ Emerging Mkt Bonds PCY 20% ^ US High Yield Bonds JNK 19% ^ International Developed Stks EFA 15% ^ Intermediate Treasuries IEF 14% ^ Commodities GSG 11% ^ US Credit Bonds CFT 11% v International Treasury Bonds BWX 8% ^ Mortgage Back Bonds MBB 7% ^ Total US Bonds BND 6% ^ Municipal Bonds MUB 6% ^ Treasury Bills SHV 0% ^
Top Five Indicators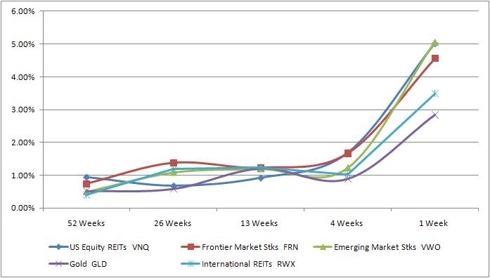
US REITs have been very strong all year, defying the perception of a weak real estate market. Emerging market and frontier markets continue their recent strength. Gold is approaching its all time high.
Bottom Five Indicators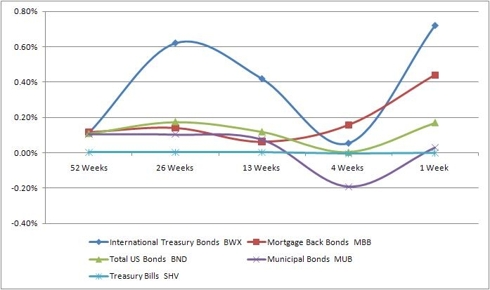
All the bottom five asset classes are fixed income, pointing to an increasing risk appetite.
In conclusion, other than long term treasury bonds, assets exhibit their continuous trends and have become stronger since QE2 announcement.labels:investment,
Symbols:EEM,VNQ,FRN,VWO,IYR,ICF,GLD,RWX,VTI,SPY,IWM,PCY,EMB,JNK,HYG,PHB,EFA,VEU,IEF,TLT,GSG,DBC,DBA,CFT,BWX,MBB,BND,MUB,SHV,AGG,
- How Plan Rating Stack up Against ETF Portfolios Returns -- Part 2
11/02/2010
We are going to use our SIBs to explore plan rating so that it is clear how it works.
We will use a six asset SIB that has Vanguard market funds and a six asset SIB that has Vanguard ETF's. Both have one fund per asset class.Asset Class Index SIB ETF SIB U.S. Equity Excluding Company Stock VTSMX VTI International Equity VGTSX VEU Emerging Markets VEIEX VWO Real Estate VGSIX VNQ Commodities DBC DBC Fixed Income Including Money Market VBMFX BND The current ratings given to each SIB are listed below.
Plan Rating Attribute Index SIB ETF SIB Diversification 60% 60% Fund Quality 74% 39% Portfolio Building 85% 81% Overall Rating 74% 62%
We base the Diversification score on nine asset classes: US Equity, International Equity, Fixed Income, Real Estate, Commodities, Emerging Markets, International Bonds, High Yield Bonds, Balanced Funds. For each asset class, except for US Equity, the diversification score is highest to plans having 4-5 funds in each asset class as this allows the investor to find and use the best funds. For an application like MyPlanIQ, the more funds the better because it can search efficiently through a large number of alternatives but that is not true in the general case. The US is treated as a special case where the sweetspot is 7-8 funds as there are more classes and more opportunities for non-correlated benefits. Each of these asset classes are combined to give the overall diversification score.
Both SIBs score identically as they each have one fund in each asset class.We base Fund Quality score on 1Yr, 3Yr, 5Yr and Inception risk adjusted returns. We make a tradeoff between the recent and more distant past. As this is primarily for longer term investments we think that the three and five year returns are the most important and so have the highest weight.
The ETF SIB scores considerably lower than the index funds and that is because many of them don't have a long history and so their historical component is zero. Whereas this is unlikely to returns performance, it is important to recognize that funds with a longer history and give them a measure of preference.
We base the Portfolio Building score on how the funds can combine to give a robust portfolio with different classes and styles being able to interact to provide consistently good results in differing conditions. To achieve this, we use our own strategic asset allocation and tactical asset allocation strategies and perform a number of different simulations.
Both SIBs score approximately the same. There are some differences in the individual behaviors of the funds that make a slight difference but not enough to be significant.
Each one of these categories is then combined to create an overall score.
Now let's see how the rating stacks up against historical returns.
Performance chart (as of Oct 29, 2010)Performance table (as of Oct 29, 2010)
Portfolio Name 1Yr AR 1Yr Sharpe 3Yr AR 3Yr Sharpe 5Yr AR 5Yr Sharpe Six Core Asset ETFs Tactical Asset Allocation Moderate 13% 87% 8% 57% 17% 114% Six Core Asset ETFs Strategic Asset Allocation Moderate 14% 104% 2% 6% 9% 42% Six Core Asset Index Funds Tactical Asset Allocation Moderate 11% 84% 8% 65% 15% 117% Six Core Asset Index Funds Strategic Asset Allocation Moderate 13% 113% 1% 2% 8% 40%
As predicted, the index SIB performance is higher. If we compare the ratio of the TAA performance of the two SIB and the ratio of the performance of the Plan rating of the two SIBs we can see that the ratio of the rating and the 5 year returns follow a similar pattern -- more of this in the final article on this.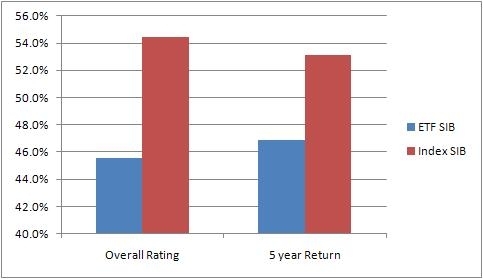
We see that the 5 year returns of the ETF SIB is higher that it's overall rating would initially predict but that is to be expected as we know that the fund quality was impacted by its history which won't, in fact, impact the returns for the period of time it was available.
labels:investment,Symbols:SPY,VTI,EFA,VEU,EEM,VWO,IYR,VNQ,ICF,AGG,BND,DBC,CIU,BIV,GWL,PFA,IVV,IYY,IWV,VV,DLN,RSP,SCHX,GMM,PXH,DEM,SCHE,GSG,
- Top Tier ETF Broker Finalists
10/28/2010
We have examined four ETF Providers, Schwab, Ameritrade, Vanguard and Fidelity.
Schwab and Fidelity were removed from the list as Ameritrade and Vanguard both had more asset classes and more funds with which to build a portfolio generating higher returns.
Ameritrade with 101 funds and Vanguard with 62 funds are left with the ability to go into deeper analysis to see whether the extra funds in Ameritrade deliver added value.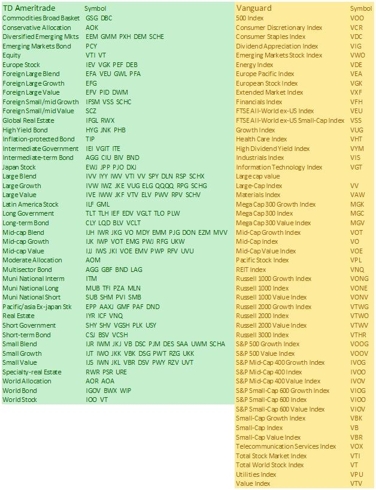
TD Ameritrade have multiple ETF's in each minor asset category whereas Vanguard does not. Both brokers offer a very broad range of US equities
Performance chart (as of Oct 25, 2010)Performance table (as of Oct 25, 2010)
Portfolio Name 1Yr AR 1Yr Sharpe 3Yr AR 3Yr Sharpe 5Yr AR 5Yr Sharpe Vanguard 62 Tactical Asset Allocation Moderate 14% 93% 5% 33% 13% 81% Vanguard 62 Strategic Asset Allocation Moderate 17% 126% 2% 5% 8% 42% TD Ameritrade Commission Free ETFs Tactical Asset Allocation Moderate 14% 96% 13% 84% 20% 128% TD Ameritrade Commission Free ETFs Strategic Asset Allocation Moderate 10% 89% -1% -10% 8% 44% labels:investment,
Symbols:SPY,VTI,EFA,VEU,EEM,VWO,IYR,VNQ,ICF,AGG,BND,HYG,JNK,PHB,CIU,BIV,GII,PUI,DBU,RYU,UPW,IYH,IXJ,VHT,XBI,PBE,DBR,RYH,IXP,PTE,DGG,LTL,IYM,IGE,VAW,XLB,XME,PYZ,DBN,RTM,UYM,MTK,PTF,DBT,RYT,ROM,GWL,PFA,IVE,IWW,JKF,VTV,ELV,PWV,RPV,SCHV,IYF,VFH,IPF,PFI,DRF,RYF,KXI,
- Ford Motor Company 401K Plan: Diversified and High Quality
10/24/2010
In this article, we will discuss Ford Motor 401K .
Ford Motor Company (Ticker: F) designs, develops, manufactures, and services cars and trucks worldwide. It operates in two sectors, Automotive and Financial Services. Ford Motor Company was founded in 1903 and is based in Dearborn, Michigan. Ford is one of the pioneers in automobile industry.
Ford Motor 401K's 401K plan consists of 24 funds. These funds enable participants to gain exposure to 4 major assets: Us Equity , Foreign Equity ,REITs, Fixed Income . The list of minor asset classes covered:
Foreign Large Blend: EFA , VEU , GWL , PFA
Foreign Small/mid Growth: IFSM , VSS , SCHC
Global Real Estate: IFGL , RWX
Inflation-protected Bond: TIP
Intermediate-term Bond: AGG , CIU , BIV , BND
Large Blend: IVV , IYY , IWV , VTI , VV , SPY , DLN , RSP , SCHX
Large Growth: IVW , IWZ , JKE , VUG , ELG , QQQQ , RPG , SCHG
Mid-cap Blend: IJH , IWR , JKG , VO , MDY , EMM , PJG , DON , EZM , MVV
Retirement Income:
Small Blend: IJR , IWM , JKJ , VB , DSC , PJM , DES , SAA , UWM , SCHA
Target Date 2016-2020: TZG
Target Date 2026-2030: TZL
Target Date 2036-2040: TZV
Target Date 2050+:
World Stock: IOO , VTAs of Oct 22, 2010, this plan investment choice is rated as Above Average based on MyPlanIQ Plan Rating methodology that was designed to measure how effective a plan's available investment funds are . It has the following detailed ratings:
Diversification -- Rated as above average (76%)
Fund Quality -- Rated as above average (69%)
Portfolio Building -- Rated as above average (71%)
Overall Rating: above average (72%)The Fund Quality ranking is very reasonable. Its selection includes Fidelity Contrafund, Neuberger Berman Genesis Instl and Royce funds.
The chart and table below show the historical performance of moderate model portfolios employing strategic and tactical asset allocation strategies ( SAA and TAA , both provided by MyPlanIQ). For comparison purpose, we also include the moderate model portfolios of a typical 4 asset SIB (Simpler Is Better) plan . This SIB plan has the following candidate index funds and their ETFs equivalent:Us Equity:( SPY or VTI )
Foreign Equity:( EFA or VEU )
Reits:( IYR or VNQ or ICF )
Fixed Income:( AGG or BND )
Performance chart (as of Oct 22, 2010)Performance table (as of Oct 22, 2010)
Portfolio Name 1Yr AR 1Yr Sharpe 3Yr AR 3Yr Sharpe 5Yr AR 5Yr Sharpe Ford Motors 401K Tactical Asset Allocation Moderate 7% 52% 8% 77% 11% 98% Ford Motors 401K Strategic Asset Allocation Moderate 11% 107% 2% 9% 6% 34% Four Core Asset Index Funds REITs Tactical Asset Allocation Moderate 12% 82% 6% 58% 10% 93% Four Core Asset Index Funds REITs Strategic Asset Allocation Moderate 14% 100% 2% 5% 6% 25% Currently, asset classes in Us Equity( SPY , VTI ) , Foreign Equity( EFA , VEU ) , REITs ( IYR , VNQ , ICF ) and Fixed Income( AGG , BND ) are doing relatively well. These asset classes are available to Ford Motor 401K participants.
To summarize, Ford Motor 401K plan provides above average choices to its plan participants. As one of the major automobile manufacturers, Ford employees can benefit from such a plan to support their retirement needs.
labels:investment,
Symbols:F,SPY,VTI,EFA,VEU,IYR,VNQ,ICF,AGG,BND,CIU,BIV,GWL,PFA,IFGL,RWX,TZG,TZL,TZV,IVV,IYY,IWV,VV,DLN,RSP,SCHX,IOO,VT,IVW,IWZ,JKE,VUG,ELG,QQQQ,RPG,SCHG,IJH,IWR,JKG,VO,MDY,EMM,PJG,DON,EZM,MVV,IFSM,VSS,SCHC,IJR,IWM,JKJ,VB,DSC,PJM,DES,SAA,UWM,SCHA,TIP,ETF,Portfolio,Building,401K,
- Core Satellite – A Way to Step Into Tactical Asset Allocation
10/19/2010
Buy and hold asset allocation has become an almost unquestioned doctrine of long term investing. The emergence of modern portfolio theory in conjunction with a long bull market seemed to prove it largely infallible.
However, recent market events have put the approach under pressure and many are considering buy and hold insufficient without some additional hedges based on what we have seen and learned.
The comparison of returns from strategic and tactical asset allocation over the last five years clearly shows the dilemma. There is a significant benefit to having a tactical component to any portfolio.
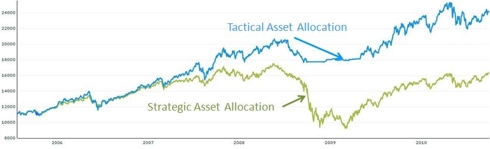
Some may still be suspicious of momentum based investing and while buy and hold has clearly had problems over the past five years there is still reluctance to move. A core satellite strategy where some of the portfolio is tactically managed and the balance is buy and hold may be a good compromise for those wanted to dip their toe into momentum based portfolios.
We have used SIB portfolios to demonstrate the benefit of asset allocation. SIB’s are made up of the market index funds so that there is no special sauce in the fund selection. We are going to extend the use of SIBs to create core satellite portfolios and compare their performance properties against a pure strategic and pure tactical asset allocation of the same fund base.
The portfolios will have six asset classes as they have an optimal level of performance traded off against the effort to maintain a large number of asset classes.
Index Funds Asset ClassTickerNameLarge BlendVTSMXVanguard Total Stock Mkt IdxForeign Large BlendVGTSXVanguard Total Intl Stock IndexDiversified Emerging MarketsVEIEXVanguard Emerging Mkts Stock IdxReal EstateVGSIXVanguard REIT IndexCommodities Broad BasketDBCPowerShares DB Commodity Idx Trking FundIntermediate-Term BondVBMFXVanguard Total Bond Market IndexETF Asset ClassesTickerLARGE BLENDVTI, SPYForeign Large BlendVEU, EFADiversified Emerging MarketsVWO, EEMReal EstateVNQ, IYRCommodities Broad BasketDBCIntermediate-Term BondBND, AGG
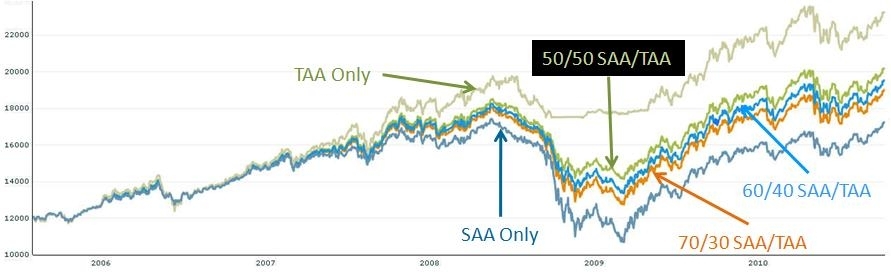
We are going to compare five portfolios:- Tactical Asset Allocation only with 40% in fixed income
- Strategic Asset Allocation only with 40% in fixed income
- 50/50 Strategic/Tactical 40%
- 60/40 Strategic/Tactical 40%
- 70/30 Strategic/Tactical 40%
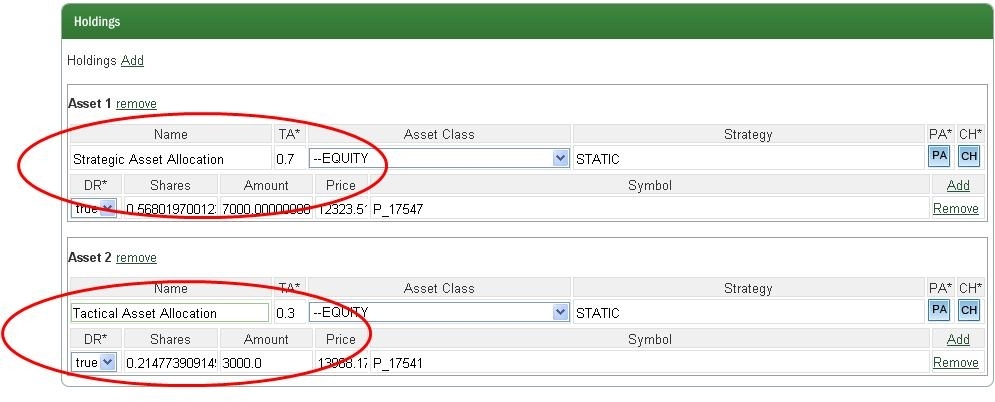
Building and maintaining a core-satellite portfolio can be labor intensive and error prone or expensive to outsource. The MyPlanIQ system enables an individual to rapidly build and maintain a model core-satellite portfolio and be able create historical results. This is how the comparison was achieved in this case.
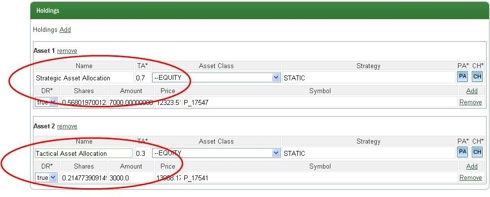
The screenshot shows how to assign a percentage of the portfolio to strategic and tactical asset allocation and then examine the performance of the portfolio. In this case, it is 70% strategic and 30% tactical asset allocation
Intuitively we would expect to see tactical asset allocation giving us the highest returns with, perhaps a little more volatility and the hybrid portfolios giving a range of returns and volatility.
Portfolio Performance ComparisonPortfolio Name1Yr AR3Yr AR5Yr AR10%9%14%11%6%11%11%5%10%12%4%10%13%2%7%
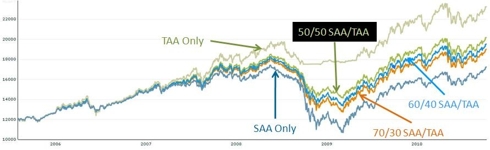
The results are much as expected with tactical asset allocation and strategic asset allocation bounding performance ranges and the core satellites filling in the middle.
The draw down ratios also behave as expected.
Portfolio/DD1 Yr3 Yr5 YrInceptionTAA10%12%14%14%50-50%9%24%24%24%60-409%27%27%27%70-308%29%29%29%SAA8%39%39%39%
The concept of a core-satellite portfolio may appeal to many. The problem of constructing an measuring such a portfolio has been greatly simplified with analytical tools such as the MyPlanIQ system.
Takeaways- In the current market conditions, tactical asset allocation still provides the best performance and has the lowest risk
- Those who want to move cautiously into momentum based portfolios can use core-satellite to dip their toe into the water
- ETF’s are an ideal, low cost vehicle to construct a core satellite portfolio
labels:investment,
Symbols:DBC,VBMFX,VTI,SPY,VEU,EFA,VWO,EEM,VNQ,IYR,BND,AGG,Portfolio-Building,with,ETFs,Closed-End,Funds,Commodity,ETFs,Developed,Market,ETFs,core-satellite,
- Case Study: Hewlett Packard's 401K Plan
10/09/2010
- Bernstein's No Brainer and Smart Money Portfolios Reviewed
10/08/2010
- Diversification, Style AND Asset Rotation Improve Portfolio Performance without Incurring Extra Risk
10/08/2010
- Google’s 401K Plan: Another Good Employee Benefit
09/26/2010
- Armstrong Index Based Lazy Portfolio Returns Study
09/17/2010
- Getting Most out of Your Retirement Plan: A Case Study on Hewlett Packard 401K Plan
09/16/2010
- John Wasik’s Nano Portfolio Performance Scrutinized
09/14/2010
- Investing with Styles Can Pay off
07/09/2010
- Understanding and Building Your ETF Portfolio
06/27/2010
- The Mystery Advisers
06/09/2010
- David Swensen's Six Asset Investment Plan
06/09/2010
- Selecting Candidate ETFs for Effective Portfolio Building
06/03/2010


- Apartment Investment and Management Company 401(k) Retirement Plan Report On 12/03/2010
12/03/2010
This report reviews Apartment Investment and Management Company 401(k) Retirement Plan plan. We will discuss the investment choices and present the plan rating by MyPlanIQ. Current economic and market conditions are discussed in the context of the investment portfolios in the plan. We will then show how participants in Apartment Investment and Management Company 401(k) Retirement Plan can achieve reasonable investment results using asset allocation strategies.
Plan Review and Rating
Apartment Investment and Management Company 401(k) Retirement Plan's 401K plan consists of 22 funds. These funds enable participants to gain exposure to 4 major assets: US Equity, Foreign Equity, REITs, Fixed Income. The list of minor asset classes covered:
Foreign Large Growth: EFG
Inflation-protected Bond: TIP
Intermediate-term Bond: AGG, CIU, BIV, BND
Large Blend: IVV, IYY, IWV, VTI, VV, SPY, DLN, RSP, SCHX
Large Growth: IVW, IWZ, JKE, VUG, ELG, QQQQ, RPG, SCHG
Large Value: IVE, IWW, JKF, VTV, ELV, PWV, RPV, SCHV
Mid-cap Blend: IJH, IWR, JKG, VO, MDY, EMM, PJG, DON, EZM, MVV
Real Estate: IYR, ICF, VNQ
Retirement Income:
Small Blend: IJR, IWM, JKJ, VB, DSC, PJM, DES, SAA, UWM, SCHA
Small Growth: IJT, IWO, JKK, VBK, DSG, PWT, RZG, UKK
Small Value: IJS, IWN, JKL, VBR, DSV, PWY, RZV, UVT
Target Date 2000-2010: TZD
Target Date 2016-2020: TZG
Target Date 2026-2030: TZL
Target Date 2036-2040: TZV
Target Date 2050+:
As of Dec 2, 2010, this plan investment choice is rated as based on MyPlanIQ Plan Rating methodology that measures the effectiveness of a plan's available investment funds. It has the following detailed ratings:
Diversification -- Rated as (76%)
Fund Quality -- Rated as (36%)
Portfolio Building -- Rated as (87%)
Overall Rating: (68%)Current Economic and Market Conditions
We have experienced an uncertain 2010: plenty of worries on whether the US economy will climb out of the great recession and recover.
- The Federal Reserve embarked on Quantitative Easing II (QE2) to stimulate the economy.
- The housing market is still at its low but largely stabilized.
- The unemployment rate is stuck at 9%.
Americans continue to face an uncertain future, given (among others) the high unemployment rate, large federal and local government debts and global trade imbalance. With such an economic backdrop, the stock and debt markets are going to be volatile. Despite this, markets have been resilient and appear positioned to rebound.
In this market it is even more critical to properly diversify and respond market changes. MyPlanIQ offers two asset allocation strategies: strategic and tactical asset allocation strategies ( SAA and TAA for participants in Apartment Investment and Management Company 401(k) Retirement Plan).
Strategic Asset Allocation is based on well known modern portfolio theory and its key features include: diversification, proper fund selection and periodically re-balancing.
Tactical Asset Allocation works on a diversified array of assets provided by funds in a plan and adjusts asset mixes based on market conditions such as asset price momentum utilized by TAA.
Portfolio Discussions
The chart and table below show the historical performance of moderate model portfolios employing strategic and tactical asset allocation strategies. For comparison purpose, we also include the moderate model portfolios of a typical 4 asset SIB (Simpler Is Better) plan . This SIB plan has the following candidate index funds and their ETFs equivalent:
US Equity: (SPY or VTI)
Foreign Equity: (EFA or VEU)
REITs: (IYR or VNQ or ICF)
Fixed Income: (AGG or BND)
Performance chart (as of Dec 2, 2010)Performance table (as of Dec 2, 2010)
Portfolio Name 1Yr AR 1Yr Sharpe 3Yr AR 3Yr Sharpe 5Yr AR 5Yr Sharpe Apartment Investment and Management Company 401(k) Retirement Plan Tactical Asset Allocation Moderate 15% 97% 10% 84% 12% 98% Apartment Investment and Management Company 401(k) Retirement Plan Strategic Asset Allocation Moderate 13% 120% 4% 19% 6% 30% Four Core Asset Index Funds REITs Tactical Asset Allocation Moderate 8% 58% 6% 54% 9% 80% Four Core Asset Index Funds REITs Strategic Asset Allocation Moderate 11% 87% 2% 6% 5% 20% Currently, asset classes in US Equity (SPY,VTI), Foreign Equity (EFA,VEU) and REITs (IYR,VNQ,ICF) are doing relatively well. These asset classes are available to Apartment Investment and Management Company 401(k) Retirement Plan participants.
To summarize, Apartment Investment and Management Company 401(k) Retirement Plan plan participants can achieve reasonable investment returns by adopting asset allocation strategies that are tailored to their risk profiles.
Symbols: AIV , SPY , VTI , EFA , VEU , IYR , VNQ , ICF , AGG , BND , CIU , BIV , EFG , IVE , IWW , JKF , VTV , ELV , PWV , RPV , SCHV , TZD , TZG , TZL , TZV , IVV , IYY , IWV , VV , DLN , RSP , SCHX , IVW , IWZ , JKE , VUG , ELG , QQQQ , RPG , SCHG , IJH , IWR , JKG , VO , MDY , EMM , PJG , DON , EZM , MVV , IJS , IWN , JKL , VBR , DSV , PWY , RZV , UVT , IJR , IWM , JKJ , VB , DSC , PJM , DES , SAA , UWM , SCHA , IJT , IWO , JKK , VBK , DSG , PWT , RZG , UKK , TIP
- Apache Design Solutions 401K Report On 12/03/2010
12/03/2010
- Peabody Investments Corp.Employee Retirement Account Report On 12/03/2010
12/03/2010
- Vanguard Variable Annuity Report On 12/06/2010
12/06/2010
- TD Ameritrade Commission Free ETFs Report On 12/07/2010
12/07/2010
- Vanguard-VA-Clone Report On 12/07/2010
12/07/2010
- David Swensen Six ETF Asset Individual Investor Plan Report On 06/02/2011
06/02/2011
- The Goldman Sachs 401(k) Plan Report On 06/03/2011
06/03/2011
- Hewlett Packard 401K Report On 06/13/2011
06/13/2011
- Hewlett Packard 401K Report On 06232011
06/23/2011