 |
Vanguard ETF: |  |
7.4%* |
|
Diversified Core: | |
8.1%* |
|
Six Core Asset ETFs: | |
7.3%* |
Articles on XLE
- Dividend Payout Reflects the New Reality
08/02/2011
With many energy and high tech stocks paying more and more dividends, the landscape of dividend payout percentages in S&P 500 has changed. In a recent article titled as Burned Before, Dividend Funds Diversify Beyond Same Old Sectors, author Sarah Morgan reported that many dividend stock funds have diversified their investment beyond financial sector concentration to other new sectors.
The following chart from the article shows the change:

It is interesting to see that now, consumer staple stocks (XLP) is the largest sector for dividend payout. With Energy (XLE) and technology (XLK) being very close to the second largest financial sector (XLY), investors are now more in favor of these two sectors.
This change bodes well to our long standing argument that
- technology companies, being one of the main beneficiaries of globalization, have better balance sheets and are now more shareholder friendly.
- resource (energy) companies will do well in the era of depleted natural and energy resources.
Dividend investors should also focus on dividend appreciation (rising dividend) instead of merely current dividend amounts (dividend hogs). The rising dividend approach will allow you to find more energy and technology companies. In fact, it will allow you to even consider those gold mining stocks (such as Newmont (NEM)) that have increased their dividends steadily recently. As gold price continues to rise, these stocks or ETFs (such as market vector gold mining stock GDX) might be worth a look.
See Retirement Income ETFs plan for portfolios using dividend and interest paying ETFs such as DVY, VIG, VYM.
Symbols: XLK, XLE, XLY, GDX, SPX, COMP, VIG, DVY, Dividend Investing, Retirement Investing
- First Pacific Advisors (FPA) Bob Rodriguez: Another Crash Coming
06/08/2011
Robert Rodriguez is the CEO of First Pacific Advisors (FPA). He managed the famed FPA Capital (FPPTX) and FPA New Income (FPNIX). He was twice named Morningstar's fixed-income manager of the year (2001 & 2008).
After taking a one year sabbatical in 2010, he came back to find that the world was still the same: problems that caused the financial crisis in 2008 had not been resolved. Here are some key points he made in a recent Fortune Magazine's article on Rodriguez:
- U.S. debt as a percentage of GDP ratio (currently 64%) is massively underreported because it doesn't count off-balance-sheet entitlements such as Medicare, and debt owed by Fannie and Freddie. If you factor in those liabilities, the ratio will be over 500%!
- The situation isn't irreparable: both parties are not willing to take drastic measures, let alone we are approaching to the election year.
- FPA Capital (FPPTX) is now 30% in cash (he had that before 2008) and 38% in energy sector (XLE). He refused to buy other sectors and even long term or intermediate term bonds (LQD) (TLT), (IEF).
At the end, as what the article stated: " A former Republican, he describes himself as a "fiscal conservative but social moderate" who has grown disgusted with both parties: "I say, 'A pox on both their houses.'""
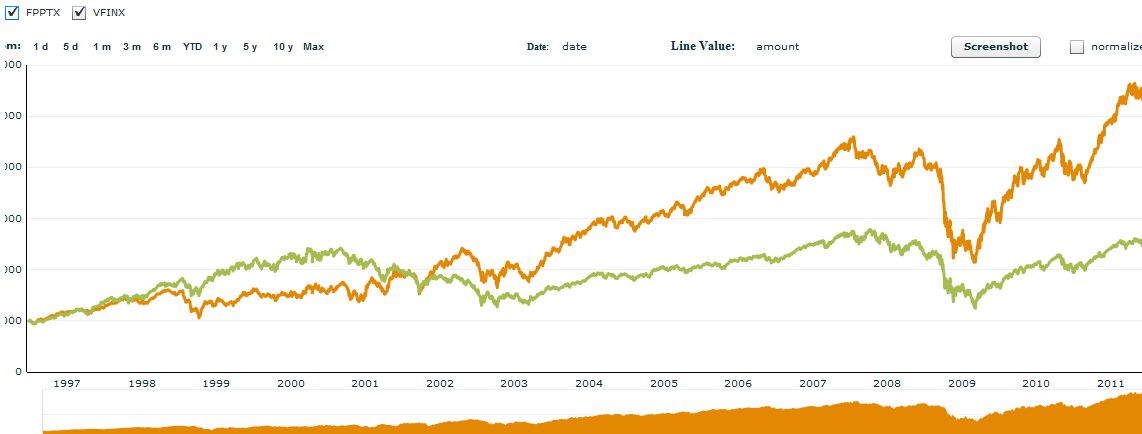
The following is the chart of FPPTX vs. VFINX (Vanguard 500 Index):
The following is the performance comparison between FPPTX and Six Core Asset ETFs Tactical Asset Allocation Moderate.
Portfolio Performance Comparison
Portfolio/Fund Name 1Yr AR 1Yr Sharpe 3Yr AR 3Yr Sharpe 5Yr AR 5Yr Sharpe FPPTX 39% 198% 8% 31% 7% 27% Six Core Asset ETFs Tactical Asset Allocation Moderate 16% 128% 9% 79% 15% 104%
See Here for more detailed comparison.See Here for another fund FPA Crecent's recent asset allocation analysis.
Symbols: SPY, TLT, XLE, IEF, FPPTX, FPNIX, VFINX
Exchange Tickers: (SPY), (TLT), (XLE), (IEF), (FPPTX), (FPNIX), (VFINX)
- US Sectors Favor Telecom, Healthcare
05/10/2011
The US Economy is divided into various Sectors. Sector are classified as General Segments of the economy within which a large group of companies can be categorized. Overall the US sectors shows good performance last year except for financial companies. The sectors that show substantial growth are energy, material and telecom industries.
Energy (XLE) returns dropped recently due to profit taking. Crude oil prices are currently at their highest level since 2008. The US Energy Information Association (EIA) predicted that oil markets will continue to tighten over the next two years due to slow growth from non-OPEC countries. Due to these events we expect the drawdown in global petroleum stocks and an increase in production demand from the OPEC countries, another reason for reducing crude oil production is the recent Libya and Middle East conflict which will disrupt the crude oil supply globally. We are expecting good growth in the energy sector as the total demand of oil grows by an annual average of 1.5 million bbl/d in 2011 and 2012.
We believe IYZ will continue to grow slowly this year. Economists and portfolio managers are moving towards technology with demands for new products as well as telecommunications providers with dividends and earnings growth. The returns are not impressive although steady in nature. Worldwide the demand of technology and telecommunication related products are gaining popularity making this sector interesting.
XLV prospects appear bright as there is a surge as the population ages and healthcare expects to double by 2018.
XLF still remain down while the things gradually improve: XLF growth is expected to be meager in 2011 but the things will improve in 2012 – 13.
The trend score is defined as the average of 1,4,13,26 and 52 week total returns (including dividend reinvested).Assets Class Symbols 05/06
Trend
Score04/29
Trend
ScoreDirection Telecom IYZ 11.63% 10.44% ^ Healthcare XLV 10.93% 10.5% ^ Industries XLI 9.92% 11.4% v Energy XLE 9.47% 17.92% v Consumer Discretionary XLY 9.37% 9.76% v Consumer Staples XLP 8.43% 8.95% v Utilities XLU 7.14% 6.48% ^ Materials XLB 6.91% 10.93% v Technology XLK 6.08% 6.94% v Financial XLF 1.08% 3.51% v Trend Rankings: The trend table ranks each of the ten U.S. industrial iShares ETFs and the score is based on the following formula: for an ETF or index, we use the average of 1, 4, 13, 26 and 52 week total returns (i.e. dividend and distribution reinvested). Notice the average of the total returns would overweight the recent price movement. This is similar to exponential moving average.
One concern: The recovery of the economy will face challenges in upcoming months as they battle huge debt. S&P recently showed concern revising US credit rating. The current administration is making plans to cut the deficit which may lead to austerity programs that could affect the overall momentum of these sectors.
Symbols: XLY, IYZ, XLI, XLB, XLK, XLE, XLF, XLP, XLU, XLV
Disclosure:
MyPlanIQ does not have any business relationship with the company or companies mentioned in this article. It does not set up their retirement plans. The performance data of portfolios mentioned above are obtained through historical simulation and are hypothetical.
- XLE The Clear Sector Leader
05/03/2011
In a retirement account, Sector investing can be very worthwhile. It can lead to portfolio returns that “beat the market”. Sectors offer a way of focusing, in a disciplined fashion, similar to looking at Countries, or broad markets. At any given point in time, one or more sectors may be out performing other sectors, and the broad stock market. Portfolios that include Sector allocation can capture this performance.
A great way to get sector exposure is through exchange traded funds. Today, there are numerous 'sector' type exchange traded funds that you can invest in. The iShares and the SPDR lineups are probably the two most popular. However there are several other providers that offer unique and interesting sector and industry ETFs.
Below is the Sector performance table, sorted by “Trend Score”, which is also posted at MyPlanIQ - Global Trends .
US Sectors TrendPerformance data are based on closing prices on April 29th 2011
Description
Symbol
1 Week
4 Weeks
13 Weeks
26 Weeks
52 Weeks
Trend Score
Energy
1.9%
0.61%
13.56%
36.92%
36.63%
17.92%
Industries
2.84%
1.9%
8.48%
21.41%
22.37%
11.4%
Materials
1.04%
1.74%
8.45%
18.79%
24.64%
10.93%
Healthcare
2.89%
5.89%
11.99%
14.16%
17.58%
10.5%
Telecom
1.95%
2.63%
7.69%
14.23%
25.69%
10.44%
Consumer Discretionary
1.6%
3.18%
9.67%
16.07%
18.29%
9.76%
Consumer Staples
2.01%
4.82%
9.38%
11.14%
17.39%
8.95%
Technology
1.48%
2.81%
3.87%
10.58%
15.95%
6.94%
Utilities
2.85%
3.24%
5.8%
6.83%
13.65%
6.48%
Financial
1.74%
-0.91%
1.06%
13.2%
2.44%
3.51%
The trend score is defined as the average of 1,4,13,26 and 52 week total returns (including dividend reinvested).
With all of the headline news lately, it is no surprise that the Energy Sector ETFs are the strongest. The holdings inside the ETFs usually include the large cap oil companies such as Exxon and Chevron, and, some of the smaller cap companies. When crude oil, and petroleum product prices rise, usually the margins of the oil companies expand. An example could be the cost of production of a barrel of crude stays relatively fixed, as the selling price of the barrel of crude goes higher. Similarly, some of the costs of refining a gallon of gasoline stay relatively fixed, as the selling price of that gallon goes higher.
These energy sector ETFs are definitely on my retirement portfolio watch list this year.
Disclosure: MyPlanIQ does not have any business relationship with the company or companies mentioned in this article. It does not set up their retirement plans. The performance data of portfolios mentioned above are obtained through historical simulation and are hypothetical.
Exchange Tickers: (NYSE:XLE), (NYSE:XLI), (NYSE:XLB), (NYSE:XLV), (NYSE:IYZ), (NYSE:XLY), (NYSE:XLP), (NYSE:XLK), (NYSE:XLU), (NYSE:XLF)
- Schwab ETF Select List Plan Offers Diversification and High Quality Fund Selection
03/16/2011
by Kevin Carr, A MyPlanIQ Expert User
On March 9, 2011, Charles Schwab announced the release of the ETF Select List. The quarterly Schwab ETF Select List was created by Charles Schwab Investment Advisory, Inc. and is a filtered list of all of the ETFs in the marketplace, highlighting pre-screened, low-cost ETFs. Schwab used quantitative and qualitative screens to filter each ETF and build the list, covering 6 major asset categories and 45 minor asset categories. All ETFs, including Schwab ETFs, are evaluated using the same criteria and broken into sectors for US Equity, Foreign Equity, Emerging Market Equity, Fixed Income, Commodity and REITs.
The ETF Select List gives investors a choice of low-cost, pre-screened ETFs. Schwab highlights just one ETF in each category, chosen based on specific criteria including expense ratio, risk, structure and how well it fits into its category. To make the list, an ETF has to meet minimum criteria that include assets under management, including narrowness of index, trading volume, bid/ask volatility, risk, annualized cost of ownership, fund structure and fit within a given category. The list excludes exchange-traded notes (ETNs), inverse or leveraged ETFs, actively managed ETFs, and unmanaged baskets of securities.
While the ETF Select List has only been out a few days, I constructed a plan on MyPlanIQ platform. The Schwab ETF Select List has no redemption periods, is commission efficient and offers low expenses.
As of March 13, the Schwab ETF Select List Plan has a four star investment menu rating with a 99% diversification score and an overall above average investment choice based on MyPlanIQ Plan Rating methodology . The Plan Rating methodology is designed to measure how effective a plan’s available funds are using key factors such as diversification, fund quality and portfolio building.
Attribute Schwab ETF Select List Six Core Asset ETF Benchmark Diversification great (99%) average (63%) Fund Quality above average (70%) below average (23%) Portfolio Building average (53%) above average (70%) Overall Rating above average (72%) average (54%) The chart and table below show the historical performance of moderate model portfolios employing strategic and tactical asset allocation strategies (SAA and TAA , both provided by MyPlanIQ). For comparison purpose, we also include the moderate model portfolios of a typical 6 asset SIB (Simpler Is Better) plan . This SIB plan has the following candidate index funds and their ETFs equivalent:
US Equity: SPY or VTI
Commodity: DBC
Foreign Equity: EFA or VEU
REITs: IYR or VNQ or ICF
Emerging Market Equity: EEM or VWO
Fixed Income: AGG or BND
Performance chart (as of Mar 15, 2011)Performance table (as of Mar 15, 2011)
Portfolio Name 1Yr AR 1Yr Sharpe 3Yr AR 3Yr Sharpe 5Yr AR 5Yr Sharpe Schwab ETF Select List Tactical Asset Allocation Moderate 9% 88% 6% 57% 12% 91% Schwab ETF Select List Strategic Asset Allocation Moderate 11% 114% 3% 15% 4% 19% Six Core Asset ETF Benchmark Tactical Asset Allocation Moderate 9% 86% 8% 65% 12% 88% Six Core Asset ETF Benchmark Strategic Asset Allocation Moderate 12% 113% 4% 17% 6% 32% Currently Commodities, Real Estate and US Equity are doing well. These asset classes are available to Schwab ETF Select List participants.
To Summarize, Schwab ETF Select List Plan offers wide diversification, high quality funds with low expenses. compared with other brokerage supported ETF plans, it is very favorable. From time to time, we will review the plan.
Symbols:DBC,DBA,IAU,DBB,USL,PFF,VNQ,XLY,XLP,XLE,XLF,XLV,XLI,XLB,XLK,IYZ,XLU,BND,SCHO,SCHR,TLH,SCHP,CIU,JNK,BWX,MUB,SCHF,EFG,EFV,SCHC,SCHE,VEU,VT,VGK,VPL,EWJ,GXC,SCHX,SCHG,SCHV,VO,VOT,VOE,SCHA,VBK,VBR,SCHB,VYM,
Symbols (exchange): (DBC),(DBA),(IAU),(DBB),(USL),(PFF),(VNQ),(XLY),(XLP),(XLE),(XLF),(XLV),(XLI),(XLB),(XLK),(IYZ),(XLU),(BND),(SCHO),(SCHR),(TLH),(SCHP),(CIU),(JNK),(BWX),(MUB),(SCHF),(EFG),(EFV),(SCHC),(
SCHE),(VEU),(VT),(VGK),(VPL),(EWJ),(GXC),(SCHX),(SCHG),(SCHV),(VO),(VOT),(VOE),(SCHA),(VBK),(VBR),(SCHB),(VYM) - Rising Energy Costs: Casting a Cloud over Energy-Dependent Sector ETFs
01/15/2011
- Most U.S. Sector End Sharply Higher For The Year
01/01/2011
- U.S. Sectors Trend: Cautious Gains Amid Mixed Catalyst
12/19/2010
- U.S. Sectors Up on Economic Hopes
12/11/2010
- US Sectors Nov 29
11/30/2010
- US Sectors Up Across the Board
11/23/2010
- Top US Sectors Weather the week well -- bottom half feels the pain
11/19/2010
- ETFs Provide Insight Into U.S. Sectors' Performance
11/12/2010