|
Vanguard ETF: |  |
7.4%* |
|
Diversified Core: | |
8.1%* |
|
Six Core Asset ETFs: | |
7.3%* |
Articles on CFT
- Earthquakes and Wars Call for Diversification and Tactical Asset Allocation in Investing
03/20/2011
Investing for wealth preservation and growth or for retirement purpose is by definition a long term process. In a long term period, experiencing wars, natural disasters and political or social unrests is a fact of life. How to deal with and navigate through these threatening events is pertinent to the success to achieve financial goals.
As baby boomers are exiting or getting ready to exit the work force, this year suddenly saw many dramatic events unfolding: Japan's earthquake and the still unfolding nuclear power meltdown events, the middle east violence with fear of radical islamic involvement and, this weekend's airstrike by allied forces on the Libyan regime are all pointing to certain tipping points in the world economic and political landscape. The new generations and the baby boomers suddenly find themselves in a world with entangled dangerous events.
The events certainly made their marks on financial markets: the big swings of the Dow Jones Industrial stocks (DJI) and S&P 500 stocks (SPY) left a dent on the otherwise stubborn euphoric markets. Most risk assets including U.S. stocks (SPY) (VTI), international stocks (EFA) (VEU), emerging market stocks (EEM) (VWO) and REITs (IYR) (VNQ) (RWX) lost ground in the last week. The only standout in the group is commodities (DBC) (GSG). For the week, DBC actually gained 0.78% while gold (GLD) gained 0.11%. For more detailed performance information, please refer to here.The key to succeed in long term investing lies in adopting sound and consistent (thus long term) strategies in managing one's portfolios. Buy and hold of a basket of major assets with properly calculated risk tolerance is one way. A more maverick way can enhance return with lower risk by adopting some tactical moves in asset allocaiton. Let's first review the following portfolios using a strategic asset allocation (buy and hold among equal weights on risk assets):A. Three Core Asset ETF Benchmark Strategic Asset Allocation Moderate (US Equity (VTI) (SPY), International Equity (VEU) and Fixed Income (BND))B. Four Core Asset ETF Index Funds Emerging Markets Strategic Asset Allocation Moderate (additonal Emerging Market Equity (VWO) (EEM))C. Five Core Asset ETF Benchmark Strategic Asset Allocation Moderate (additional US REITs (VNQ) (IYR) added)D. Five Core Asset ETF With Commodity Benchmark Strategic Asset Allocation Moderate(additional commodities (DBC) added to the four asset portfolio)E. Six Core Asset ETFs Strategic Asset Allocation Moderate (include US Equity, International Equity, Emerging Market Equity, REITs, Commodities and Fixed Income)
Portfolio Performance Comparison
Portfolio Name 1Yr AR 1Yr Sharpe 3Yr AR 3Yr Sharpe 5Yr AR 5Yr Sharpe Three Core Asset ETF Benchmark Strategic Asset Allocation Moderate 10% 69% 3% 13% 4% 14% Six Core Asset ETFs Strategic Asset Allocation Moderate 11% 89% 4% 17% 7% 31% Four Core Asset ETF Index Funds Emerging Markets Strategic Asset Allocation Moderate 9% 70% 4% 17% 6% 26% Five Core Asset ETF With Commodity Benchmark Strategic Asset Allocation Moderate 11% 85% 3% 12% 6% 29% Five Core Asset ETF Benchmark Strategic Asset Allocation Moderate 11% 76% 4% 16% 5% 19%
For the week, Six Core Asset ETFs Strategic Asset Allocation Moderate lost 0.34% compared with 0.66% loss of Five Core Asset ETF Benchmark Strategic Asset Allocation Moderate or 0.68% loss of Three Core Asset ETF Benchmark Strategic Asset Allocation Moderate. With the smaller loss of REITs and the commodity performance, diversification does show its advantage during the market stress.The last ten years experienced two major economic downturns: the technology bubble burst in 2000-2002 and the financial bubble burst in 2008-2009. The pure buy and hold strategy, even with proper diversification, does not shield its portfolios from big loss. A more active portfolio strategy such as this tactical asset allocation strategy (TAA) can be used. The following again compares the five portfolios with 3,4,5,6 assets using TAA. All of them are moderate risk portfolios.
Portfolio Performance Comparison
Portfolio Name 1Yr AR 1Yr Sharpe 3Yr AR 3Yr Sharpe 5Yr AR 5Yr Sharpe Three Core Asset ETF Benchmark Tactical Asset Allocation Moderate -3% -32% 2% 16% 4% 28% Six Core Asset ETFs Tactical Asset Allocation Moderate 9% 67% 10% 78% 14% 96% Four Core Asset ETF Index Funds Emerging Markets Tactical Asset Allocation Moderate -2% -16% 7% 62% 10% 64% Five Core Asset ETF With Commodity Benchmark Tactical Asset Allocation Moderate 2% 18% 5% 43% 10% 64% Five Core Asset ETF Benchmark Tactical Asset Allocation Moderate 6% 42% 7% 60% 10% 63% The six asset portfolio with TAA actually had a slight gain in the last week and it is also positive in the last month. This clearly illustrates that tactical asset allocation over a diverse array of major assets can be effective.The following table shows the trend scores of major assets ending 3/18/2011.
The trend score is defined as the average of 1,4,13,26 and 52 week total returns (including dividend reinvested).Assets Class Symbols 03/18
Trend
Score03/11
Trend
ScoreDirection Commodities DBC 14.15% 12.94% ^ Gold GLD 8.86% 9.46% v US Equity REITs VNQ 5.89% 8.03% v US Stocks VTI 5.55% 8.03% v International Treasury Bonds BWX 5.07% 4.04% ^ International REITs RWX 4.27% 6.89% v US High Yield Bonds JNK 3.74% 4.13% v Emerging Market Stks VWO 2.97% 4.64% v Intermediate Treasuries IEF 1.82% 1.16% ^ US Credit Bonds CFT 1.71% 1.71% v Total US Bonds BND 1.12% 0.97% ^ International Developed Stks EFA 0.87% 3.28% v Emerging Mkt Bonds PCY 0.57% 1.18% v Mortgage Back Bonds MBB 0.23% 0.12% ^ Treasury Bills SHV 0.05% 0.05% v Municipal Bonds MUB -0.9% -1.22% ^ Frontier Market Stks FRN -3.22% 1.01% v In conclusions, no one has a crystal ball to predict the future. The effective way to cope with major risks for mankind is to adhere to sound portfolio strategies such as asset allocation with diversification and tactical allocation based on prevailing events.
Symbols:EEM,VNQ,FRN,VWO,IYR,ICF,GLD,RWX,VTI,SPY,IWM,PCY,EMB,JNK,HYG,PHB,EFA,VEU,IEF,TLT,GSG,DBC,DBA,CFT,BWX,MBB,BND,MUB,SHV,AGG ,Exchange,Tickers,(NASDAQ,EEM),(NASDAQ,VNQ),(NASDAQ,FRN),(NASDAQ,VWO),(NASDAQ,IYR),(NASDAQ,ICF),(NASDAQ,GLD),(NASDAQ,RWX),(NASDAQ,VTI),(NASDAQ,SPY),(NASDAQ,IWM),(NASDAQ,PCY),(NASDAQ,EMB),(NASDAQ,JNK),(NASDAQ,HYG),(NASDAQ,PHB),(NASDAQ,EFA),(NASDAQ,VEU),(NASDAQ,IEF),(NASDAQ,TLT),(NASDAQ,GSG),(NASDAQ,DBC),(NASDAQ,DBA),(NASDAQ,CFT),(NASDAQ,BWX),(NASDAQ,MBB),(NASDAQ,BND),(NASDAQ,MUB),(NASDAQ,SHV),(NASDAQ,AGG),
Disclosure:
MyPlanIQ does not have any business relationship with the company or companies mentioned in this article. It does not set up their retirement plans. The performance data of portfolios mentioned above are obtained through historical simulation and are hypothetical.
- 'Safe' Assets' Trends Back to Positive: Risk Aversion Began?
03/14/2011
Risk assets' correction in last week was across the board: virtually all risk assets, other than US REITs (VNQ), turned up negative. Among them, both international stocks (EFA) and commodities (DBC) had the largest drops: both lost 3.09%. On the other hand, most 'safe' assets had a positive week. For more detailed performance for last week, please refer to here.
From the following table, one can see that other than municipal bonds (MUB), all of 'safe' fixed income assets now have positive trend scores, meaning their return behaviors are better than cash or short term treasury bill (SHV).Assets Class Symbols 03/11
Trend
Score03/04
Trend
ScoreDirection Commodities DBC 12.94% 16.8% v Gold GLD 9.46% 9.66% v US Stocks VTI 8.03% 10.61% v US Equity REITs VNQ 8.03% 8.47% v International REITs RWX 6.89% 9.33% v Emerging Market Stks VWO 4.64% 7.17% v US High Yield Bonds JNK 4.13% 4.99% v International Treasury Bonds BWX 4.04% 3.49% ^ International Developed Stks EFA 3.28% 7.15% v US Credit Bonds CFT 1.71% 1.09% ^ Emerging Mkt Bonds PCY 1.18% 0.29% ^ Intermediate Treasuries IEF 1.16% -0.27% ^ Frontier Market Stks FRN 1.01% 2.22% v Total US Bonds BND 0.97% 0.05% ^ Mortgage Back Bonds MBB 0.12% -0.55% ^ Treasury Bills SHV 0.05% 0.01% ^ Municipal Bonds MUB -1.22% -1.24% ^ The trend score is defined as the average of 1,4,13,26 and 52 week total returns (including dividend reinvested).
It is especially telling that the trend score of intermediate term treasury bonds (IEF) are now positive, ahead of frontier market stocks (FRN). Is this the beginning of a turn?
Fundamentally, stocks across the globe are not cheap. Based on Valueline, Capital IQ and Bloomberg data collected by Prof. Damodaran at NYU, as of January 2011, the world market valuation is as follows:Aggregate Market Cap/Aggregate Net Income US 27 Europe 20 Emerging Market 21.9 Global 23.1
By no means, the equity markets are cheap. In fact, Shiller's CAPE 10 for US stocks is currently at 24.4, compared with its long term average 16.4 (see more detailed info here). This is about 49% over valued!
Coupled with the recent relentless ascent in all risk asset prices, the markets are very prone to sharp gyration.
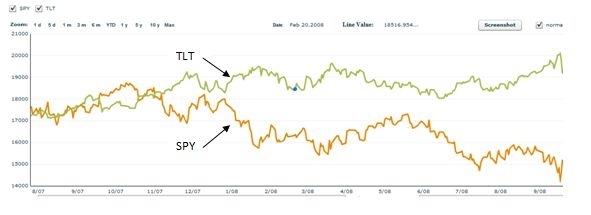
Fortunately, major stock market downturns were usually preceded by relative strong movements of other assets, especially 'safe' assets. For example, at the end of 2007, fixed income investors started to sense the danger in general economies, long term treasury bonds (TLT) started to show its strength in 8/2007. In fact, by the end of 2007, TLT has shown enough strength to be ahead of SPY. The following chart shows the total returns of both SPY and TLT between 2007 to 2008.

Nobody can predict the future and we don't know what will lie ahead this time. However, as long as one maintains a risk level that is suitable to his/her situations and adheres to a systematic way to properly allocate assets, one can withstand possible market shocks. Moreover, adopting a more active monitoring on major asset movements can be helpful to make tactical decision in risk asset exposures. For example, a tactical asset allocation strategy that uses major asset trends was effective in the last two major stock bear markets, based on historical simulation.
Though current situation does not warrant a dramatic change of asset allocations, investors with over allocated risk asset exposure should start to lighten up and get back to their normal risk level. It is a prudent way to avoid big loss in one's portfolios.Symbols: EEM,VNQ,FRN,VWO,IYR,ICF,GLD,RWX,VTI,SPY,IWM,PCY,EMB,JNK,HYG,PHB,EFA,VEU,IEF,TLT,GSG,DBC,DBA,CFT,BWX,MBB,BND,MUB,SHV,AGG ,Symbols,(exchange), (NYSE,EEM),(NYSE,VNQ),(NYSE,FRN),(NYSE,VWO),(NYSE,IYR),(NYSE,ICF),(NYSE,GLD),(NYSE,RWX),(NYSE,VTI),(NYSE,SPY),(NYSE,IWM),(NYSE,PCY),(NYSE,EMB),(NYSE,JNK),(NYSE,HYG),(NYSE,PHB),(NYSE,EFA),(NYSE,VEU),(NYSE,IEF),(NYSE,TLT),(NYSE,GSG),(NYSE,DBC),(NYSE,DBA),(NYSE,CFT),(NYSE,BWX),(NYSE,MBB),(NYSE,BND),(NYSE,MUB),(NYSE,SHV),(NYSE,AGG),
Disclosure:
MyPlanIQ does not have any business relationship with the company or companies mentioned in this article. It does not set up their retirement plans. The performance data of portfolios mentioned above are obtained through historical simulation and are hypothetical.
- Major Assets: Risk Assets Strong While Safe Assets Have Negative Trends
03/07/2011
Another week went by with risk assets being in much favor. This is especially true for the traditionally considered 'riskiest' assets including emerging market equities (VWO), commodities (DBC), frontier market equities (FRN) and gold (GLD). For the week, they were all up more than 1%. For more detailed performance, see here.
The following table shows the trend scores for all major asset ETFs:
Assets Class Symbols 03/04
Trend
Score02/25
Trend
ScoreDirection Commodities DBC 16.8% 16.74% ^ US Stocks VTI 10.61% 13.06% v Gold GLD 9.66% 9.84% v International REITs RWX 9.33% 11.37% v US Equity REITs VNQ 8.47% 12.41% v Emerging Market Stks VWO 7.17% 7.07% ^ International Developed Stks EFA 7.15% 9.77% v US High Yield Bonds JNK 4.99% 5.55% v International Treasury Bonds BWX 3.49% 2.85% ^ Frontier Market Stks FRN 2.22% 1.08% ^ US Credit Bonds CFT 1.09% 0.76% ^ Emerging Mkt Bonds PCY 0.29% 0.07% ^ Total US Bonds BND 0.05% -0.04% ^ Treasury Bills SHV 0.01% 0.03% v Intermediate Treasuries IEF -0.27% -0.52% ^ Mortgage Back Bonds MBB -0.55% -1.21% ^ Municipal Bonds MUB -1.24% -1.08% v The trend score is defined as the average of 1,4,13,26 and 52 week total returns (including dividend reinvested).
From the above table, we can see the often considered 'safe' assets: Intermediate Treasuries (IEF), Morgage Back Bonds (MBB) and Municipal bonds (MUB) all have negative trends, meaning they under performed against even cash (SHV). We have seen this again and again this year. Risk appetite is high right now.
For the fixed incomre portion of a portfolio, at the moment, the international bonds (BWX) and investment grade corporate bonds (CFT) still offer some good value. International bonds (BWX) has been doing well amid the weakness of US dollars: Powershares US Bullishp (UUP) is down more than 2% year to date.
Year to date, the portfolio with commodity exposure is outperforming the one without commodity. The following table shows the comparison:
Portfolio Performance Comparison
Portfolio Name YTD AR 1Yr AR 1Yr Sharpe 3Yr AR 3Yr Sharpe 5Yr AR 5Yr Sharpe Five Core Asset Index ETF Funds Strategic Asset Allocation Moderate 1.86% 16% 127% 6% 27% 8% 33% Six Core Asset ETFs Strategic Asset Allocation Moderate 2.92% 16% 131% 5% 22% 7% 35%
As we pointed out in a separate article, simply adding commodity asset (DBC) to a strategic asset allocation portfolio does not necessarily enhance the risk adjusted return. For the moment, positioning in risk assets, especially in commodities and US stocks (VTI) has done well. One, however, needs a systematic way such as a tactical asset allocation strategy to manage risk.
Symbols: EEM,VNQ,FRN,VWO,IYR,ICF,GLD,RWX,VTI,SPY,IWM,PCY,EMB,JNK,HYG,PHB,EFA,VEU,IEF,TLT,GSG,DBC,DBA,CFT,BWX,MBB,BND,MUB,SHV,AGG,
Disclosure:
MyPlanIQ does not have any business relationship with the company or companies mentioned in this article. It does not set up their retirement plans. The performance data of portfolios mentioned above are obtained through historical simulation and are hypothetical.
- Commodities Showed Their Hedge Amid Equity Weakness
02/28/2011
Last week, all major global stock markets registered loss: Frontier stocks (FRN) lost most -- -2.6%, followed by Emerging market stocks (VWO) -- -1.89%, and U.S. stock markets (VTI) -- -1.73%. REITs also showed their weakness. Commodities, however, showed their hedging nature, gaining 3.42%. Gold (GLD) gained 1.46%. Other fixed income ETFs all had positive gains too. For more detailed performence update, please refer to here.
The following table shows the trend scores for all major asset classes we monitor.Assets Class Symbols 02/25
Trend
Score02/18
Trend
ScoreDirection Commodities DBC 16.74% 13.62% ^ US Stocks VTI 13.05% 14.82% v US Equity REITs VNQ 12.41% 14.34% v International REITs RWX 11.37% 11.76% v Gold GLD 9.84% 8.93% ^ International Developed Stks EFA 9.77% 10.71% v Emerging Market Stks VWO 7.08% 7.87% v US High Yield Bonds JNK 5.55% 5.5% ^ International Treasury Bonds BWX 2.85% 2.86% v Frontier Market Stks FRN 1.08% 2.41% v US Credit Bonds CFT 0.76% 0.38% ^ Emerging Mkt Bonds PCY 0.07% -0.07% ^ Treasury Bills SHV 0.03% 0.01% ^ Total US Bonds BND -0.04% -0.49% ^ Intermediate Treasuries IEF -0.52% -1.33% ^ Municipal Bonds MUB -1.08% -1.17% ^ Mortgage Back Bonds MBB -1.21% -1.51% ^ The trend score is defined as the average of 1,4,13,26 and 52 week total returns (including dividend reinvested).
We pointed out the role of commodities in asset allocation of a portfolio several months ago. The following table shows the performance of two portfolios using a tactical asset allocation strategy: one has five core asset classes, eash of which is represetned by a single ETF, as its candidate funds: U.S. equity (VTI, SPY), Foreign equity (VEU, EFA), Emerging market equity (VWO, EEM), U.S. REITs (IYR, VNQ) and fixed income (BND, AGG). The other has six core assets that includes an additional commodity index ETF (DBC) as its sixth asset.
The following table compares the performance of two moderate portfolios for these two plans.Portfolio Name 1Yr AR 1Yr Sharpe 3Yr AR 3Yr Sharpe 5Yr AR 5Yr Sharpe Six Core Asset ETFs Tactical Asset Allocation Moderate 16% 120% 10% 82% 15% 100% Five Core Asset Index ETF Funds Tactical Asset Allocation Moderate 13% 97% 10% 85% 13% 85%
It is clear that adding commodity as a candidate asset for an asset allocation strategy does increase the return and Sharpe ratio (thus, risk adjusted return). However, to achieve this, one should follow a systematic asset allocation strategy like the one mentioned above and handle commodity and other asset classse exposures carefully.
Disclosure:
MyPlanIQ does not have any business relationship with the company or companies mentioned in this article. It does not set up their retirement plans. The performance data of portfolios mentioned above are obtained through historical simulation and are hypothetical.
Symbols: EEM,VNQ,FRN,VWO,IYR,ICF,GLD,RWX,VTI,SPY,IWM,PCY,EMB,JNK,HYG,PHB,EFA,VEU,IEF,TLT,GSG,DBC,DBA,CFT,BWX,MBB,BND,MUB,SHV,AGG,
- Major Asset Trends: U.S. Stocks and REITs Strong, International Bonds Worth Considering
02/22/2011
U.S. stock market has been persistently in a steady up trend: last week, U.S. total stock market index (VTI, SPY) finally notched up to the first place in our trend ranking among major asset classes. For the week, VTI was up 1.15%. Gold (GLD) was up most, followed by emerging market and developed stock market indices (VWO, EFA). All were up more than 2%. For more performance details, please refer to here.
The following table shows the trend scores for major assets. The top three assets are U.S. stocks (VTI), U.S. Equity REITs (VNQ) and commodities (DBC). Fixed income bond ETFs are still ranked at the bottom.
Assets Class Symbols 02/18
Trend
Score02/11
Trend
ScoreDirection US Stocks VTI 14.82% 14.32% ^ US Equity REITs VNQ 14.34% 15.18% v Commodities DBC 13.62% 13.58% ^ International REITs RWX 11.76% 9.27% ^ International Developed Stks EFA 10.71% 9.16% ^ Gold GLD 8.93% 6.85% ^ Emerging Market Stks VWO 7.87% 5.43% ^ US High Yield Bonds JNK 5.5% 5.93% v International Treasury Bonds BWX 2.86% 0.67% ^ Frontier Market Stks FRN 2.41% 2.49% v US Credit Bonds CFT 0.38% 0.28% ^ Treasury Bills SHV 0.01% 0.03% v Emerging Mkt Bonds PCY -0.07% -0.87% ^ Total US Bonds BND -0.49% -0.98% ^ Municipal Bonds MUB -1.17% 0.24% v Intermediate Treasuries IEF -1.33% -2.13% ^ Mortgage Back Bonds MBB -1.51% -2.27% ^ The trend score is defined as the average of 1,4,13,26 and 52 week total returns (including dividend reinvested).
It has been a difficult period for fixed income investors: the total U.S. bond index (BND, AGG) had a negative trend score, ranking below cash or Treasury Bills (SHV), though it still registered a 2.18% total return in the past 52 weeks. We have pointed out that to achieve better returns, one should branch out to consider international bonds such as BWX or emerging market bonds (PCY). With U.S. dollar index (UUP) is again in a downtrend and its weak fundamental, one should consider to include international bonds such as BWX. Last week, BWX was ranked just below U.S. high yield bonds (JNK), placed in the second place among fixed income bond ETFs in the above table.
Investors considering to have exposure to international bonds should look at a tactical asset allocation strategy that includes a diversified array of bond index funds. Please refer to this portfolio.
Disclosure:
MyPlanIQ does not have any business relationship with the company or companies mentioned in this article. It does not set up their retirement plans. The performance data of portfolios mentioned above are obtained through historical simulation and are hypothetical.Symbols:EEM,VNQ,FRN,VWO,IYR,ICF,GLD,RWX,VTI,SPY,IWM,PCY,EMB,JNK,HYG,PHB,EFA,VEU,IEF,TLT,GSG,DBC,DBA,CFT,BWX,MBB,BND,MUB,SHV,AGG,
- Major Asset Trends: Divergence of U.S. Stocks and Emerging Market Stocks Continues
02/14/2011
- Risk Chase Slows Down: A Good Time to Review Your Portfolios
01/10/2011
- Risk Appetite in Major Assets Increases
01/03/2011
- End of the Year Review of Luminary Portfolios -- II
01/01/2011
- Major Asset Movements Muted, Bonds Continue to Stabilize
12/27/2010
- Major Asset Trends: Municipal and Other Bonds Recover Some, Commodities Strong
12/20/2010
- U.S. Stocks Strong; Other Bond Markets Continue to Slump
12/13/2010
- Major Asset Trends: Emerging Market Stocks Had a Bigger Drop while U.S. REIT Held Up Well
11/30/2010
- ETF Based Major Asset Class Trend Indicators For The Week of November 15
11/15/2010
- ETF Based Major Asset Class Trend Indicators For The Week of November 8
11/08/2010
- Lazy Portfolios -- The Playoffs II
10/19/2010
- Lazy Portfolios -- The Playoffs
10/19/2010