 |
Vanguard ETF: |  |
7.4%* |
|
Diversified Core: | |
8.1%* |
|
Six Core Asset ETFs: | |
7.3%* |
Articles on VIG
- Retirement Income ETFs vs. Income Mutual Funds: An Update
09/11/2011
We first compared asset allocation portfolios using dividend ETFs (and bond ETFs) and those using income mutual funds on SeekingAlpha.com Retirement Income Investing: ETFs vs. Mutual Funds more than two months ago. Let's review these two plans: Retirement Income ETFs and Schwab Income Mutual Fund Select List.
Here are the asset classes covered by the two plans:
The list of minor asset classes covered by Retirement Income ETFs The list of minor asset classes covered by Schwab Income Mutual Fund Select List Diversified Emerging Mkts: EEM, VWO, DEM
Emerging Markets Bond: EMB, PCY
Equity Energy: AMJ
Foreign Large Value: PID, IDV
Global Real Estate: RWX
High Yield Bond: HYG
Inflation-protected Bond: TIP
Intermediate Government: IEI
Intermediate-term Bond: CIU, CORP, MBB
Large Blend: VIG
Large Value: DVY, SDY, VYM, FVD
Long Government: IEF, TLT
Long-term Bond: LQD, VCLT
Mid-cap Value: PEY
Miscellaneous Sector: PFF
Muni National Long: MUB
Muni Short: SHM
Real Estate: IYR, ICF, VNQ
Short Government: SHY
Short-term Bond: CSJ, VCSH
World Bond: BWX, WIPEmerging Markets Bond: TGINX
Foreign Large Blend: SICNX, LISOX
Foreign Large Value: AAIPX
High Yield Bond: STHTX, MWHYX
Inflation-protected Bond: ACITX
Intermediate Government: SWGSX, CPTNX
Intermediate-term Bond: SWIIX, SAMFX, PTTDX, PGBOX, MWTRX, FTRFX
Large Blend: SWANX, TICRX, PRBLX
Large Growth: SWLSX, JENSX
Large Value: TWEIX, PQIAX
Mid-cap Blend: NMMCX
Mid-cap Value: ARDEX
Multisector Bond: PONDX
Muni National Interm: SWNTX, TWTIX, STTBX
Muni National Long: NOTEX, ACLVX
Muni Short: FSHIX
Real Estate: CSRSX
Short Government: FIGTX
Short-term Bond: FSTIX, ACSNX
Ultrashort Bond: SIGVX
World Bond: PFODXAsset Class Retirement Income ETFs Schwab Income Mutual Fund Select List REITs 4 1 Fixed Income 19 24 Sector Fund 2 0 Foreign Equity 2 3 Emerging Market Equity 3 0 US Equity 6 9 Other 0 0 Total 36 37 Little in the two plans' investment choice ratings has changed since then. As of Sep 9, 2011, Retirement Income ETFs investment choice is rated as average and Schwab Income Mutual Fund Select List investment choice is rated as above average based on MyPlanIQ Plan Rating methodology that was designed to measure how effective a plan's available investment funds are . It has the following detailed ratings:
Attribute Retirement Income ETFs Schwab Income Mutual Fund Select List Diversification great (95%) great (85%) Fund Quality below average (29%) great (85%) Portfolio Building above average (67%) above average (71%) Overall Rating average (64%) above average (80%)
Performance chart (as of Sep 9, 2011)Performance table (as of Sep 9, 2011)
Portfolio Name 2011 YTD 1Yr AR 1Yr Sharpe 3Yr AR 3Yr Sharpe 5Yr AR 5Yr Sharpe Retirement Income ETFs Tactical Asset Allocation Moderate 2.49% 8% 80% 11% 84% 10% 71% Retirement Income ETFs Strategic Asset Allocation Moderate -1.16% 5% 42% 5% 23% 3% 14% Schwab Income Mutual Fund Select List Tactical Asset Allocation Moderate 3% 9% 84% 11% 101% 10% 92% Schwab Income Mutual Fund Select List Strategic Asset Allocation Moderate -2.11% 4% 35% 4% 27% 3% 16% Refer to detailed portfolio comparison.
Again, we are seeing income ETFs can still rival the well selected income mutual funds. This is a good news for income investors in their IRA investments or taxable account investments. ETFs have more flexibility and have a well defined and simple indexing strategy (isn't this what MyPlanIQ is also doing?).
Disclosure:MyPlanIQ does not have any business relationship with the company or companies mentioned in this article. It does not set up their retirement plans. The performance data of portfolios mentioned above are obtained through historical simulation and are hypothetical.
Symbols: SPX, VIG, DVY, SDY, ICF, RWX, HYG, LQD, IEF, TLT, TIP, AMJ, TWEIX, LISOX, CSRSX, PTTDX, Retirement Investments, IRAs, ETF Portfolios, Portfolio Management, Risk Management, Dividend ETFs
- Portfolio Management: Best of Fixed Income Managers vs. Retirement Income ETFs
09/08/2011
Two defensive investment strategies useful in current stressful times are compared. The first is based on selecting the best bond fund every month or every quarter from a list of bond funds managed by Morningstar's 'Manager of the Year' P Bond Funds Momentum Based on Upgrading Fixed Income Managers of the Year`s Funds Monthly. These funds include PTTRX, TGLMX, WATFX, MWTRX, LSBDX, DODIX, FPNIX.
The second is Retirement Income ETFs that consists of a list of candidate dividend stock and bond ETFs including DVY, EMB, HYG, ICF, IDV, TIP, VIG, VWO.
The conclusion: the Fixed Income Managers of the Year is solid and has lower volatility, a good defensive strategy one should consider. Both of them are better alternatives than a broad based index such as S&P 500 (SPX) or total bond market index (AGG)
Read more from our SeekingAlpha's article:
Defensive Strategies In Stressful Times: The Best Of Fixed Income
Symbols: SPX, DVY, EMB, HYG, ICF, IDV, TIP, VIG, VWO, PTTRX, TGLMX, WATFX, MWTRX, LSBDX, DODIX, FPNIX, Retirement Investing, Dividend Stock, Retirement Income, Portfolio Management
- Dividend Payout Reflects the New Reality
08/02/2011
With many energy and high tech stocks paying more and more dividends, the landscape of dividend payout percentages in S&P 500 has changed. In a recent article titled as Burned Before, Dividend Funds Diversify Beyond Same Old Sectors, author Sarah Morgan reported that many dividend stock funds have diversified their investment beyond financial sector concentration to other new sectors.
The following chart from the article shows the change:

It is interesting to see that now, consumer staple stocks (XLP) is the largest sector for dividend payout. With Energy (XLE) and technology (XLK) being very close to the second largest financial sector (XLY), investors are now more in favor of these two sectors.
This change bodes well to our long standing argument that
- technology companies, being one of the main beneficiaries of globalization, have better balance sheets and are now more shareholder friendly.
- resource (energy) companies will do well in the era of depleted natural and energy resources.
Dividend investors should also focus on dividend appreciation (rising dividend) instead of merely current dividend amounts (dividend hogs). The rising dividend approach will allow you to find more energy and technology companies. In fact, it will allow you to even consider those gold mining stocks (such as Newmont (NEM)) that have increased their dividends steadily recently. As gold price continues to rise, these stocks or ETFs (such as market vector gold mining stock GDX) might be worth a look.
See Retirement Income ETFs plan for portfolios using dividend and interest paying ETFs such as DVY, VIG, VYM.
Symbols: XLK, XLE, XLY, GDX, SPX, COMP, VIG, DVY, Dividend Investing, Retirement Investing
- Dividend Stock ETF Investing: Growth vs. Value
05/24/2011
Dividends have been long considered to be an important metric to value a company. In essence, dividends are the cash payment out of earnings from a company. If a company has a mandate to reward its shareholders with part of its earnings, company management is more responsible for and conscious on their excessive earnings: give back to shareholders or plow them back for future growth. This puts a check on executives to curb their growth at any price or expand company bureaucracy for their own purposes.
Dividend ETFs are favorable investing vehicles in retirement investing. This is especially important for retirees or baby boomers who are relying dividends as part of their income. These ETFs have been used to build lower risk and higher return asset allocation portfolios such asRetirement Income ETFs. Please refer to this article for more details.
Two popular strateggies are employed in dividend stock investing: dividend growth (or appreciation) vs. dividend weighted (or hogs). The former selects and weighs more heavily on stocks that have a record of increasing dividends over time. The latter basically weighs more heavily on stocks that have higher yields (with the exception of filtering out some lower grade stocks). If one views dividends are a stream of earnings that are actually materialized to be delivered to shareholders over time, the dividend growth approach is like growth at a reasonable price while dividend hogs is like value investing.
These two strategies are used for most of dividend stock ETFs. The following is a list of some of these U.S. dividend stock ETFs:
Vanguard Dividend Appreciation (VIG) Growth Vanguard High Dividend Yield Indx (VYM) Hogs First Trust Value Line Dividend Index (FVD) Growth iShares Dow Jones Select Dividend Index (DVY) Hogs PowerShares HighYield Dividend Achievers (PEY) Growth SPDR S&P Dividend (SDY) Hogs The dividend growth strategy puts more weight on high quality companies that have increased their dividends over time. The high dividends are not the primary focus. Companies that increase dividend payout over time in general should have better cash flow and higher confidence in their future earnings. They are also more shareholder friendly. Such strategy has been long adopted in investment communities. Some of the best investment newsletters such as Valueline and Investment Quality Trends have had model portfolios employing this approach for more than 30 years.
The high dividend (or so called 'dividend hog') strategy, on the other hand, might run into dangers of investing in companies that merely try to maintain high dividends to appeal to investors.
The following table & chart show the performance of the above ETFs:
Portfolio Performance Comparison
Portfolio/Fund Name 1Yr AR 1Yr Sharpe 3Yr AR 3Yr Sharpe 5Yr AR 5Yr Sharpe PEY 19% 105% -2% -9% -4% -18% FVD 27% 147% 4% 18% 8% 29% DVY 28% 208% 1% 3% 0% -3% VIG 25% 143% 5% 18% 5% 16% VYM 28% 152% 3% 6% From the above, it is clear that dividend growth ETFs outperformed dividend hog ETFs. Part of the reason is that during the 2008-2009 financial crisis, high dividend financial companies such as banks and mortgage companies were severely damaged.Disclosure: MyPlanIQ does not have any business relationship with the company or companies mentioned in this article. It does not set up their retirement plans. The performance data of portfolios mentioned above are obtained through historical simulation and are hypothetical.Symbols: VIG, VYM, SDY, FVD, DVY, PEY
- Recent Calamities Don’t Slow Down US Equities But What’s Coming Next is Anybody’s Guess
03/30/2011
Catastrophic events in Japan left the world in shock, and brought an economic powerhouse to a temporary standstill seems to have had little impact on US equities as the immediate drama dies down. North Africa and the Middle East still have the possibility of exploding.
Despite everything, US growth appears to be still on track. Labor markets and last quarter’s GDP 3.1% shows the economy is moving in the right direction despite consumer sentiment being on the low side which is to be expected with current events.
US ASSETS CLASS RETURNS
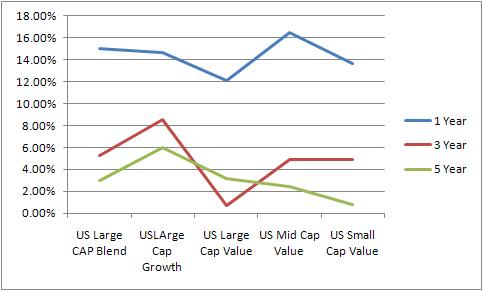
In US Equities, Large Cap Value is towards the bottom of the table as investors are looking for more risk with higher returns. However, in the light of current events and evidence of risk, large cap (safe) and value (higher return) may be an interesting compromise. Over the past five years US LARGE CAP GROWTH (ETF) has the highest 5 year returns and US MID CAP VALUE (ETF) the highest one year return.
Description
Symbol
1 Yr
3 Yr
5 Yr
1 Yr Sharpe
SPDR Dow Jones Industrial Aver
12.09%
0.73%
3.17%
72.34%
Vanguard Dividend Appreciation
11.54%
3.01%
NA
69.21%
Vanguard Value ETF
11.43%
-0.38%
1.43%
62.67%
iShares Dow Jones Select Divid
11.23%
-1.78%
-1.82%
73.78%
iShares Russell 1000 Value Ind
11.04%
-1.14%
0.29%
59.07%
iShares S&P 500 Value Index
10.73%
-1.73%
-0.29%
55.86%
SPDR S&P Dividend
8.88%
3.44%
2.12%
54.49%
This chart shows the top large cap value ETFs based on volume and return. Without sufficient volume, any ETF can suffer low liquidity or high trading friction.
The best performers in the US Large cap value stocks are:
1. SPDR Dow Jones Industrial Aver (DIA)
2. Vanguard Dividend Appreciation (VIG)
DIA is star performer in terms of return the 1 year returns are 12.09 % with an average volume of 7.8 million. The 5 year yields are also the highest at 3.17% giving us added confidence.
VIG is the second best perfomer with the return of 11.54% in year although the VIG is a new ETF being in market for less than 5 years the overall performance is very good the three year yields are 3%.
The large cap value ETF are those whose values are above that $10 billion, the size of these ETF’s give them the favourable advantage in the event of volatile period as these fund related investments are less riskier due to the change in terms of environmental factor.
Currently they are out of favour with those who are looking for return but in these days of increasing risk awareness, perhaps they will come back into fashion.
Disclosure:
MyPlanIQ does not have any business relationship with the company or companies mentioned in this article. It does not set up their retirement plans. The performance data of portfolios mentioned above are obtained through historical simulation and are hypothetical.
Symbols:DIA,DVY,IVE,IWD,SDY,VIG,VTV,SPY,VTI,
Symbols: (NYSE: DIA), (NYSE: DVY), (NYSE: IVE), (NYSE: IWD), (NYSE: SDY), (NYSE: VIG), (NYSE: VTV), (NYSE: SPY), (NYSE: VTI)
- Tactically Manage An Income Producing Portfolio With Commodity Exposure
03/25/2011
- Dividend Stock ETFs Somewhat Defensive But Not Enough to Withstand Market Stress
03/17/2011
- Riding High with Global Economy, International REITs Offer Currency and Inflation Hedge
03/10/2011
- Dividend ETFs: Public REITs Offer Good Value While Economy Recovers
03/04/2011
- Morningstar's 401K Clone Begs the Question- What about Managed Funds?
02/27/2011
- Dividend Stock ETFs All Dropped, But Showing Defensive
02/24/2011
- Initiating Tracking of US Subclasses
02/22/2011
- Initiating Tracking of US Subclasses
02/22/2011
- RSP Leads US Large Cap Blend Equities
02/14/2011
- Yield Quest Turns from Bonds to High Yield Stocks
12/16/2010
- ETF's for Income Nov 29
11/29/2010
- ETF's for Income Rebound Well
11/23/2010
- High Dividend Stock ETFs for Income Producing Portfolios
11/12/2010
- Retirement Income Portfolio Building Using ETFs and Asset Allocation Strategies
11/12/2010
- The Goldman Sachs 401(k) Plan Report On 06/03/2011
06/03/2011
Retirement investing is a long term process. This report reviews The Goldman Sachs 401(k) Plan . We will discuss the investment choices and present the plan rating by MyPlanIQ. Current economic and market conditions are discussed in the context of the investment portfolios in the plan. We will then show how investors in The Goldman Sachs 401(k) Plan can achieve reasonable investment results using asset allocation strategies.
Plan Review and Rating
As one of the largest investment banks in the world, Goldman Sachs (GS) does give its employees ample diversification opportunities. The plan consists of 36 funds. These funds enable participants to gain exposure to 6 major assets: US Equity, Foreign Equity, Commodity, Emerging Market Equity, REITs, Fixed Income.
As of Jun 2, 2011, this plan investment choice is rated as average based on MyPlanIQ Plan Rating methodology that measures the effectiveness of a plan's available investment funds. It has the following detailed ratings:
Diversification -- Rated as great (100%)
Fund Quality -- Rated as below average (14%)
Portfolio Building -- Rated as average (52%)
Overall Rating: average (55%)It is a bit surprising that the plan's fund quality is rated below average. In the plan, other than the low cost index funds, it provides many Goldman Sachs funds such as Goldman Sachs Asset Management L.P./Structured US Equity Fund (GSELX). This could possibly help your own fund business with the expense of lower qualities. We don't know what cost the plan is charged for these funds.
Current Economic and Market Conditions
As we are clearly entering a seasonally weak period for risk assets, global economies have clearly slowed down. Recently released Case-Shiller housing index showed that the U.S. is now in a double dip state for housing prices. Unemployment rate has been stuck at 9% level. Additional indicators such as conference board consumer confidence index and Chicago ISM index are all pointing to a slow down in the summer season.
Amid a string of bad economic news, risk assets have come down a bit, though they are still ranked high at the moment. Long term treasury bonds, however, have shot up in the anticipation of weakened economy. The following table shows the major asset class ranking in terms of their momentum.
Assets Class Symbols 05/27
Trend
Score05/20
Trend
ScoreDirection International REITs RWX 11.77% 10.82% ^ Commodities DBC 10.84% 10.32% ^ US Equity REITs VNQ 10.77% 10.41% ^ Gold GLD 9.42% 10.06% v Emerging Market Stks VWO 8.56% 6.72% ^ US Stocks VTI 8.29% 8.23% ^ International Developed Stks EFA 6.77% 5.23% ^ US High Yield Bonds JNK 6.37% 6.37% v International Treasury Bonds BWX 5.96% 4.66% ^ Frontier Market Stks FRN 4.05% 4.27% v Emerging Mkt Bonds PCY 3.57% 4.27% v Intermediate Treasuries IEF 2.71% 2.39% ^ US Credit Bonds CFT 2.5% 2.81% v Municipal Bonds MUB 2.13% 2.0% ^ Total US Bonds BND 1.99% 1.92% ^ Mortgage Back Bonds MBB 1.75% 1.8% v Treasury Bills SHV 0.07% 0.02% ^ Portfolio Discussions
The chart and table below show the historical performance of moderate model portfolios employing strategic and tactical asset allocation strategies. For comparison purpose, we also include the moderate model portfolios of a typical 6 asset SIB (Simpler Is Better) plan . This SIB plan has the following candidate index funds and their ETFs equivalent:
US Equity: SPY or VTI
Foreign Equity: EFA or VEU
Commodity: DBC
Emerging Market Equity: EEM or VWO
REITs: IYR or VNQ or ICF
Fixed Income: AGG or BND
Performance chart (as of Jun 2, 2011)Performance table (as of Jun 2, 2011)
Portfolio Name 1Yr AR 1Yr Sharpe 3Yr AR 3Yr Sharpe 5Yr AR 5Yr Sharpe The Goldman Sachs 401(k) Plan Tactical Asset Allocation Moderate 12% 113% 9% 70% 13% 98% The Goldman Sachs 401(k) Plan Strategic Asset Allocation Moderate 17% 214% 1% 5% 5% 30% Six Core Asset ETF Benchmark Tactical Asset Allocation Moderate 14% 141% 8% 64% 13% 92% Six Core Asset ETF Benchmark Strategic Asset Allocation Moderate 20% 188% 3% 16% 7% 36% From the above table, one can see that the plan is comparable with six core asset benchmark.
To summarize, participants in The Goldman Sachs 401(k) Plan can achieve very reasonable investment returns by adopting asset allocation strategies that are tailored to their risk profiles. This plan provides adquate diversification but can be improved by working on fund qualities.
Symbols:GS, ^RUT, MLM, VTI, VEU, VWO, VNQ, DBC, BND, STLEX, SVSPX, VUSTX, VIGIX, VIVIX, VIMSX, SSEMX, VIPSX, STLAX, STLBX, WFBIX, STLCX, STLDX, STLFX, GMCFX, GSTGX, WACPX, GSELX, GCMAX, GSHTX, GSCGX, GSLAX, GSFIX, GGOIX, GREIX, QRAAX, PIGLX, SVRIX
Exchange Tickers: (GS), (^RUT), (CASH), (MLM), (VTI), (VEU), (VWO), (VNQ), (DBC), (BND), (STLEX), (SVSPX), (VUSTX), (VIGIX), (VIVIX), (VIMSX), (SSEMX), (VIPSX), (STLAX), (STLBX), (WFBIX), (STLCX), (STLDX), (STLFX), (GMCFX), (GSTGX), (WACPX), (GSELX), (GCMAX), (GSHTX), (GSCGX), (GSLAX), (GSFIX), (GGOIX), (GREIX), (QRAAX), (PIGLX), (SVRIX)