 |
Vanguard ETF: |  |
7.4%* |
|
Diversified Core: | |
8.1%* |
|
Six Core Asset ETFs: | |
7.3%* |
Articles on DIA
- Recent Calamities Don’t Slow Down US Equities But What’s Coming Next is Anybody’s Guess
03/30/2011
Catastrophic events in Japan left the world in shock, and brought an economic powerhouse to a temporary standstill seems to have had little impact on US equities as the immediate drama dies down. North Africa and the Middle East still have the possibility of exploding.
Despite everything, US growth appears to be still on track. Labor markets and last quarter’s GDP 3.1% shows the economy is moving in the right direction despite consumer sentiment being on the low side which is to be expected with current events.
US ASSETS CLASS RETURNS
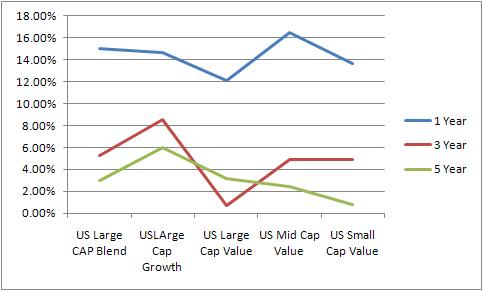
In US Equities, Large Cap Value is towards the bottom of the table as investors are looking for more risk with higher returns. However, in the light of current events and evidence of risk, large cap (safe) and value (higher return) may be an interesting compromise. Over the past five years US LARGE CAP GROWTH (ETF) has the highest 5 year returns and US MID CAP VALUE (ETF) the highest one year return.
Description
Symbol
1 Yr
3 Yr
5 Yr
1 Yr Sharpe
SPDR Dow Jones Industrial Aver
12.09%
0.73%
3.17%
72.34%
Vanguard Dividend Appreciation
11.54%
3.01%
NA
69.21%
Vanguard Value ETF
11.43%
-0.38%
1.43%
62.67%
iShares Dow Jones Select Divid
11.23%
-1.78%
-1.82%
73.78%
iShares Russell 1000 Value Ind
11.04%
-1.14%
0.29%
59.07%
iShares S&P 500 Value Index
10.73%
-1.73%
-0.29%
55.86%
SPDR S&P Dividend
8.88%
3.44%
2.12%
54.49%
This chart shows the top large cap value ETFs based on volume and return. Without sufficient volume, any ETF can suffer low liquidity or high trading friction.
The best performers in the US Large cap value stocks are:
1. SPDR Dow Jones Industrial Aver (DIA)
2. Vanguard Dividend Appreciation (VIG)
DIA is star performer in terms of return the 1 year returns are 12.09 % with an average volume of 7.8 million. The 5 year yields are also the highest at 3.17% giving us added confidence.
VIG is the second best perfomer with the return of 11.54% in year although the VIG is a new ETF being in market for less than 5 years the overall performance is very good the three year yields are 3%.
The large cap value ETF are those whose values are above that $10 billion, the size of these ETF’s give them the favourable advantage in the event of volatile period as these fund related investments are less riskier due to the change in terms of environmental factor.
Currently they are out of favour with those who are looking for return but in these days of increasing risk awareness, perhaps they will come back into fashion.
Disclosure:
MyPlanIQ does not have any business relationship with the company or companies mentioned in this article. It does not set up their retirement plans. The performance data of portfolios mentioned above are obtained through historical simulation and are hypothetical.
Symbols:DIA,DVY,IVE,IWD,SDY,VIG,VTV,SPY,VTI,
Symbols: (NYSE: DIA), (NYSE: DVY), (NYSE: IVE), (NYSE: IWD), (NYSE: SDY), (NYSE: VIG), (NYSE: VTV), (NYSE: SPY), (NYSE: VTI)
- Initiating Tracking of US Subclasses
02/22/2011
We are initiating weekly tracking of the nine different styles or subclasses in the US Equity asset class. We use ETFs to represent each sub-class. We track returns over 1, 4, 13, 26, and 52 weeks and aggregate them to get a trend score. We then track the trend score to see the direction of each representative ETF in the subclass. By using an ETF from the same provider, we are attempting to normalize out performance of the ETF over the performance of the subclass.
Assets Class
Symbols
02/18
Trend
Score02/11
Trend
ScoreDirection
Russell Smallcap Growth
IWO
20.85%
19.88%
^
Russell Smallcap Index
IWM
18.7%
17.58%
^
Russell Midcap Growth
IWP
18.3%
18.8%
v
Russell Smallcap Value
IWN
17.28%
16.08%
^
Russell Midcap Index
IWR
16.68%
16.74%
v
Russell Midcap Value
IWS
15.91%
15.66%
^
Russell Largecap Growth
IWF
14.31%
14.08%
^
Russell Largecap Index
IWB
13.44%
13.04%
^
Russell Largecap Value
IWD
13.27%
12.67%
^
The trend score is defined as the average of 1,4,13,26 and 52 week total returns (including dividend reinvested).
We note that most of the of the sub-classes are positive as the US bull market continues. We also note that Midcap is dropping in comparison to Smallcap - Midcap has been at the top of the list but is starting to be replaced by Smallcap. Finally we note that the order within a sub-class is Growth, Index (Blend), Value.
Although the entire top three dropped compared to the prior week, the smalcaps dropped less than the midcap stock. The continuing bull market is moving investors away from the relative safety of large cap to the small cap stocks. The midcap, which had been a nice midway point, is being supplanted by the smallcap options as investors seek to maximize returns.
The large cap stocks are solidly at the bottom of the table as investors look for higher returns. We note that the Largecap Value has the best performance in the short term even though it has had the poorest return over the longer time horizon.
We would expect to see this picture to remain for some time unless the unrest in the Middle East and North Africa causes investors to look for safer US equities.
Symbols:VCR,VDC,VIG,VWO,VDE,VEA,VGK,EDV,VFH,VEU,VSS,VUG,VHT,VYM,VIS,VGT,BIV,VCIT,BLV,VCLT,VGLT,VAW,MGC,MGK,MGV,VO,VOT,VOE,VMBS,VPL,VNQ,BSV,VGSH,VB,VBK,VBR,VOX,BND,VTI,VT,VPU,VTV,IJK,VBK,QQQQ,MDY,IWO,IJT,IJH,VB,VXF,IWP,IJR,VO,VOT,IWR,IJJ,VBR,IJS,IWN,RSP,IWM,IWS,VOE,VTV,IWC,SCHA,VTI,DIA,VUG,IWF,SPY,IWB,SDY,IVW,VIG,IVV,IWD,OEF,IVE,DVY,
Disclosure:
MyPlanIQ does not have any business relationship with the company or companies mentioned in this article. The performance data of portfolios mentioned above are obtained through historical simulation and are hypothetical.
- RSP Leads US Large Cap Blend Equities
02/14/2011
ETFs are becoming ubiquitous and there are increasing numbers that "do the same thing." ETFs are much more accessible to the general public and with increasing numbers of brokers offering low or no commission trades provided they are held for a month or more, it may be hard to know which ETF to select.
MyPlanIQ has recently completed a major review of all the leading ETFs in the US Equities asset class and we are going to dig a little deeper to determine which ETFs would provide the highest returns. We start with the large cap blend ETFs.
The first thing to note is that none of the large cap blend ETFs come in the top ten list of the US equity ETFs. RSP is 19th, VTI is 26th and SPY is 30th.Ticker
Description
5 Yr AR%
3yr AR%
1yr AR%
Rydex S&P Equal Weight
3.45%
3.58%
27.38%
Vanguard Total Stock Mkt
2.12%
0.59%
23.75%
SPDR S&P 500
2.07%
-0.11%
21.68%
The second thing to note is that RSP has a clear win against VTI and SPY. There is a great deal of debate about whether equal weight equities make sense but, in pure returns terms, they clearly perform better.
We observe that RSP has more volatility and does better in good times and worse in bad times. We also observe that VTI and SPY have similar performance characteristics.
When we go back to performance of all ETF's in the US asset class we note that the top ten comprises four small cap, five mid cap and one large cap ETFs.
Being equally weighted means that the smaller companies (albeit in the large cap class) have a larger percentage of the portfolio in RSP than in VTI and SPY. Therefore, it leans more towards mid cap behaviors.
In times of financial stress, the larger caps are going to be preferred which would favor SPY and VTI but when things are recovering, the smaller company leaning RSP is going win out and that is what happens.
When it comes to expenses, RSP is the most expensive to own. Their cost is 0.4% whereas Vanguard is 0.07% and Spyder is 0.0945%. This makes RSP a relatively expensive ETF to own but the returns are there as the returns reported are net of management fees.
If your investment strategy is to fire and forget then maintaining some large cap equities is going to be important to get through future financial heavy weather that will come sooner or later -- RSP and VTI.
If you are going to have regular reviews and be willing to move from mid cap to large cap, then RSP is a reasonable hedge but you might decide to leave out large cap blend subclass all together for now.Symbols:IJK,VBK,QQQQ,MDY,IWO,IJT,IJH,VB,VXF,IWP,IJR,VO,VOT,IWR,IJJ,VBR,IJS,IWN,RSP,IWM,IWS,VOE,VTV,IWC,SCHA,VTI,DIA,VUG,IWF,SPY,IWB,SDY,IVW,VIG,IVV,IWD,OEF,IVE,DVY
Tags, ETFs, US Equity, Portfolio Construction
- End of the Year Review of Luminary Portfolios -- II
01/01/2011
Earlier in the year, we presented a series of reports on lazy portfolios from investing luminaries. We went on to pit them together to come out with an overall winner.
That was then, this is now. It's time to review their progress and look at how they have performed in 2010. This is the second article where we look at the bottom half of the alphabet and see how they have done this year.
We created SIB (Simpler is Better) portfolios one index fund for each asset class (ETF's are ideal for this) as a basic benchmark for each asset class portfolio. A SIB gives you diversification and low cost with no thought to picking a stock or even sub-segment of an asset class.
MyPlanIQ Benchmark
TAA 5 Yr Return Annualized
TAA 1 Year
SAA 1 Year
Asset Classes
15%
8%
10%
6
12%
7%
10%
6
11%
6%
11%
5
9%
8%
11%
4
11%
1%
10%
4
6%
-1%
10%
3
We present four return data points:
- The five year annualized return based on a Tactical Asset Allocation strategy (TAA) -- this gives a viewpoint on the longer term behavior
- The one year TAA return
- The one year Strategic Asset Allocation (SAA) return
We note that for 2010, SAA portfolios have performed better than the SAA but TAA has a better performance metric in the longer run. This will calibrate what we see with the lazy portfolios.
The portfolios are listed by decreasing number of asset classes and decreasing number of funds. We would expect that the portfolio with the greatest number of asset classes to have the highest returns and we will test that to see to what extent it is true.
Table of Lazy Portfolios and their classes and funds
Plan Name
TAA 5 Yr Return Annualized
TAA 1 Year
SAA 1 Year
Original
Asset Classes
11%
6%
11%
7%
5
10%
9%
11%
13%
6
13%
7%
13%
15%
3
6%
10%
14%
9%
3
13%
11%
14%
12%
7
11%
10%
10%
13%
5
9%
9%
13%
11%
4
- Gibson's 5 Equal Asset Allocation Strategy comes from his Asset Allocation: Balancing Financial Risks book. In it, he outlined a simple yet diversified asset allocation model: putting equal amount of investment into 5 asset classes: US Equity, International Equity, REIT, Commodity, Fixed Income.
- Alexander Green proposed this The Gone Fishin' Portfolio. Based on the book the allocation is achieved using Vanguard low cost index funds (in Bogleheads forum, there is a discussion thread devoted to this portfolio)
- Jim Lowell edits MarketWatch's ETF Trader, an investment letter employing a momentum-based exchange-traded-fund strategy for long-term investors. Large and small stocks, proposed his Sower's Growth Portfolio. This is a diversified portfolio of exchange-traded funds
- Bill Schulthe is is a former Smith Barney broker and author of "The Coffeehouse Investor"
- Craig L. Israelsen is an Associate Professor at Brigham Young University where he teaches Personal and Family Finance to over 1,200 students each year. The Israelsen Seven Equally Weighted is aimed to protect the portfolio against losses
- David Swensen, the Yale Endowment Manager, proposed a one size fit in all model portfolio for individual investors. The major difference of this portfolio is the emphasis on international equities (including emerging market equities) and real estate
- John Wasik is a professional journalist and author specializing in personal finance, the environment, investing and social issues. John has proposed a Nano plan investment portfolio which employs a handful of index or ETFs to cover virtually the entire world of bond and stock markets
The one year returns of the original portfolio are presented in order of highest to lowest.
How do the returns compare to what we would have expected?
Plan Name
TAA 5 Yr Return Annualized
TAA
1 Year ReturnSAA
1 Year ReturnOriginal 1Year
Asset Classes
13%
7%
13%
15%
3
10%
9%
11%
13%
6
11%
10%
10%
13%
5
13%
11%
14%
12%
7
9%
9%
13%
11%
4
6%
10%
14%
9%
3
11%
6%
11%
7%
5
- The second half of the group performed slightly better as a group than the first half. Lowell's return is the highest of the bunch -- as a three asset class portfolio, that will be an interesting study as to whether this will continue in 2011
- All of the portfolios exhibited the same behavior of the buy and hold approaches beating TAA -- this is an important lesson that TAA, while having significant benefits in a choppy market, may not perform as well as SAA in a good market
- As we end the year on a relatively strong note, there is still a note of caution and concern about the future and we will have to see how well these portfolios perform next year
Takeaways- 2010 has been a good year for lazy portfolios as stocks have continued their recovery albeit with concern for the future
- TAA has real benefits but so does SAA or buy and hold -- this year demonstrates this point
- Index funds continue to show good results against managed funds
- Larger asset class plans have the benefit of stability and good returns
- ETF’s can be used to implement any of these strategies
- We pick the top three -- Lowell, Green and Swensen Brown to move on to the finals
- The Seven-12 portfolio can feel hard done by because if it were in the top half of the draw, it would have made it through to the finals
labels:investment,
Symbols:ACWI,ACWX,ADRE,AGG,BIV,BLV,BND,BSV,BWX,CFT,CIU,CSJ,DBC,DBV,DIA,DVY,EDV,EEM,EFA,EFG,EFV,EMB,ETF,GLD,GOOG,GSG,GXC,HPQ,HYG,ICF,IEF,IEI,IFGL,IGOV,IGR,IJH,IJJ,IJK,IJR,IJS,IJT,IVE,IVV,IVW,IWB,IWC,IWD,IWF,IWM,IWN,
- Lazy Portfolios -- The Playoffs II
10/19/2010
This is the second article as we attempt to whittle down the lazy portfolios to four finalists for great analysis of what makes for a great portfolio. We are in the bottom half of the alphabetical list and the eight are listed in reducing order asset classes and funds. We have stated that the winners should be those with the most asset classes and highest number of funds.
Portfolio Classes Funds ETF Equivalent Seven-12 7 12 Y SIX SIB SAA 6 6 y Gone Fishin' 5 10 y Swensen 6 4 6 Y Wasik`s Nano 4 5 Y Harry Browne 3 4 Y Schultheis 3 3 Y Lowell 2 8 Y We are using this series of comparisons to validate whether this proves to be true.- Craig L. Israelsen, Ph.D., is an Associate Professor at Brigham Young University. The Seven Equally Weighted, twelve fund portfolio is aimed to protect against losses.
- The MyPlanIQ six asset SIB has index funds for each of the asset classes represented and rebalances monthly – this is primarily a benchmark portfolio
- Alexander Green proposed this The Gone Fishin' Portfolio which was outlined in his book 'The Gone Fishin' Portfolio'
- David Swensen, the Yale Endowment Manager, proposed this one size fit in all model portfolio for individual investors.
- John Wasik has been a professional journalist and author for 30 years specializing in personal finance. John proposed a portfolio which employs a handful of index or ETFs
- Harry Browne is the author of Fail-Safe Investing
- Bill Schulthe is is a former Smith Barney broker and author of "The Coffeehouse Investor."
- Jim Lowell edits MarketWatch's ETF Trader, an investment letter employing a momentum-based exchange-traded-fund strategy for long-term investors.
The returns are now presented in order of highest to lowest of the five year returns. How do the returns compare to what we would have expected?
Portfolio/AR(%) 1 Yr 3 Yr 5 Yr Inception Harry Browne 12.49 7.40 8.99 7.31 Six SIB SAA 12.54 1.61 7.44 8.26 Seven-12 15.55 0.80 6.41 6.16 Swensen Six 15.10 (0.24) 6.21 7.10 Gone Fishin' 12.98 (0.34) 5.64 6.72 Wasik`s Nano 15.34 (1.93) 4.74 4.66 Schultheis 9.23 (2.28) 4.68 4.59 Lowell 12.45 (6.26) 3.55 6.74 - The portfolios roughly follow the asset class/fund class as would be expected
- The Harry Browne portfolio stands out as the clear exception to the rule – it has a signnificant lead over the other portfolios
- The six asset SIB performed well – that was expected. Six asset classes with index funds should perform well
When we look at the drawdown for each of the portfolios, it will reveal which is the most painful to own.Portfolio/DD1 Yr3 Yr5 YrInceptionHarry Browne5%15%15%15%Swensen Six8%39%39%39%Six SIB SAA8%39%39%39%Schultheis9%39%39%39%Seven-128%40%40%40%Gone Fishin'9%42%42%42%Wasik`s Nano9%44%44%44%Lowell16%57%57%57%
Again the Harry Browne portfolio is the clear winner.
We select the top two – which are the Harry Browne and Six asset SIB to move to the final round where they will be put against the best two funds from the top half of the alphabet.
Takeaways- The portfolios followed the expected path against asset classes and funds
- The Harry Browne portfolio was the clear winner and was the exception – we will find out in the final article whether it proves the rule
- With the exception of the Harry Browne portfolio, the drawdown ratios are uncomfortably high
- ETF’s can be used to implement any of these strategies
labels:investment,
Symbols:ACWI,ACWX,ADRE,AGG,BIV,BLV,BND,BSV,BWX,CFT,CIU,CSJ,DBC,DBV,DIA,DVY,EDV,EEM,EFA,EFG,EFV,EMB,ETF,GLD,GOOG,GSG,GXC,HPQ,HYG,ICF,IEF,IEI,IFGL,IGOV,IGR,IJH,IJJ,IJK,IJR,IJS,IJT,IVE,IVV,IVW,IWB,IWC,IWD,IWF,IWM,IWN,Portfolio-Building,with,ETFs,Closed-End,Funds,Commodity,ETFs,Currency,ETFs,Developed,Market,ETFs,
- Lazy Portfolios -- The Playoffs
10/19/2010
- Armstrong Index Based Lazy Portfolio Returns Study
09/17/2010
- How Does Your Garden Grow?
09/16/2010