 |
Vanguard ETF: |  |
7.4%* |
|
Diversified Core: | |
8.1%* |
|
Six Core Asset ETFs: | |
7.3%* |
Articles on VGSIX
- Keep It Simple Stupid -- A Simple Benchmark to Measure Your Investment Returns
04/19/2011
Living on borrowed time: nuclear reactors, oppressive governments, levees that keep out flood waters -- keeping things going -- just one more year. The temptation to delay until next time is very seductive until disaster strikes and the cost to repair, dwarfs the cost to prevent. Many working people put off their retirement investing -- just one more year until it becomes a "hair on fire" problem -- which it now is for baby boomers for whom retirement is a near and present danger.There is an easy to understand strategy that can improve returns with low risk. If you have a portfolio with the correct asset classes represented, over the long term, you will get better results at a lower risk than picking the latest and greatest fund or stock. This is not the bleeding edge of new ideas. This is proven and widely used – being the basis of most money manager’s strategies.
MyPlanIQ created SIB portfolios (Simpler Is Better) – market index funds from key asset classes that can be used to measure historical returns to show the impact of asset class selection rather than fund or stock selection. SIB portfolios for different numbers of asset classes are built and used to benchmark returns. From this, conclusions can be drawn as to what is an effective investment strategy for today.
The following funds were used:
Index Funds Asset Class
Ticker
Name
Large Blend
Vanguard Total Stock Mkt Idx
Foreign Large Blend
VGTSX
Vanguard Total Intl Stock Index
Diversified Emerging Markets
VEIEX
Vanguard Emerging Mkts Stock Idx
Real Estate
VGSIX
Vanguard REIT Index
Commodities Broad Basket
PowerShares DB Commodity Idx Trking Fund
Intermediate-Term Bond
Vanguard Total Bond Market Index
ETF Asset Classes
Ticker
Description
LARGE BLEND
Vanguard Total Stock Market ETF
Foreign Large Blend
Vanguard FTSE All-World ex-US ETF
Diversified Emerging Markets
Vanguard Emerging Markets Stock ETF
Real Estate
Vanguard REIT Index ETF
Commodities Broad Basket
DBC
PowerShares DB Commodity Idx Trking Fund
Intermediate-Term Bond
Vanguard Total Bond Market ETF
Three Asset Class SIB: The three core assets are U.S. and international equities and fixed income. This represents what used to be conventional wisdom: Heavy dependence on the U.S. and the rest of the developed world. With a conservative strategic asset allocation strategy, the portfolio would consist of 60% fixed income and 20% each for U.S. and international equities. With a tactical asset allocation strategy, the fixed income would never be less than 60% but the split of the three asset classes would move based on asset price movement.
Three Core Asset Portfolios
1 year AR
3 year AR
5 year AR
SAA Index
11%
1%
4%
SAA ETF Index
15%
1%
3%
TAA Index
7%
4%
6%
TAA ETF Index
9%
4%
5%
The SAA (buy and hold) strategy represents what many people may end up with. There is little thought put into which asset classes are represented but these are the most likely ones to be covered.
The TAA strategy gives a little higher long term performance because of the ability to move to other asset classes when one aspect of the economy is slowing.It’s clear that world economics has changed; becoming smaller, more interlinked and complex. It’s no longer possible to ignore the impact of emerging markets and we are very aware that real estate has an impact on the economy.
If you are just using three asset classes, you should look to upgrade your portfolio immediately.
Four Asset Class SIB: There are two variants for the four asset class SIB. Either add emerging markets or real estate trusts to the three asset class SIB. Note that the international asset class means established nations such as those in Europe and emerging asset classes are represented by developing nations. With a conservative strategic asset allocation strategy, the portfolio would consist of 60% fixed income and 13.33% each for U.S., international and REIT or emerging market equities. With a tactical asset allocation strategy, the fixed income would never be less than 60% but the split of the three asset classes would move based on asset price movement.
Four Core Asset Portfolios
1 year AR
3 year AR
5 year AR
SAA Em Index
12%
2%
6%
SAA REIT Index
17%
2%
5%
SAA ETF Em
16%
2%
6%
TAA Emerging
11%
7%
10%
TAA REIT
15%
6%
8%
TAA ETF Em
15%
7%
11%
Adding another asset class improves the performance as it balances risk. TAA is also able to increase its long term benefit over SAA as there are more asset classes to move into when one of the asset classes is not performing properly. Choosing between REIT and emerging markets is hard and further diversification is of long term value.
If you are using a four asset class portfolio, you could be doing better. Making the choice between emerging markets and real estate is a tough one.
Five Asset Class SIB: Has been covered in a previous article and the results are included for completeness. The five class SIB takes both REIT and Emerging markets so is a fusion of the two four asset class SIBs.
Five Core Asset Portfolios
1 year AR
3 year AR
5 year AR
SAA Index
15%
3%
5%
SAA ETF
20%
3%
7%
TAA Index
15%
8%
10%
TAA ETF
19%
8%
12%
The five asset class SIB is a strong platform for portfolio creation. It has broad diversification and, with tactical asset allocation, good returns.
If you are using a five asset class portfolio, you are in good shape – but take a look at the six asset class portfolio because it will be increasingly important in the current macro economic climate.
Six Asset Class SIB: The last asset class adds commodities to the portfolio. This gives another type of asset class and will further help diversification
Adding another asset class does not significantly improve the result within the 5 year time frame. It may be asked whether the extra effort of building and managing a six asset class portfolio is worth it. Broader diversification is good, but is it really necessary? In our view, the addition of commodities will be increasingly important as commodities will protect against inflation as the recovery slowly continues and there is increasing inflationary pressure.
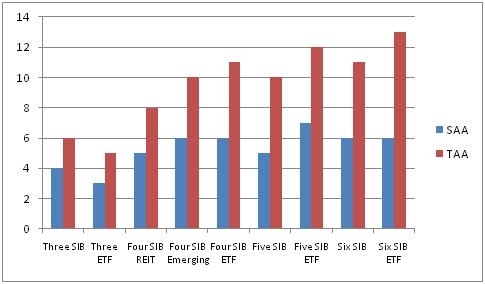
Figure 1 5 Year Annualized Returns for the different SIBs with SAA and TAA strategies
What conclusions can be drawn from this?
-
It’s time to leave a three asset class portfolio in the past. The world is more connected and complex and higher returns require more sophistication
-
Four and five asset class portfolios have fared well and show solid returns but everybody should consider adding commodities in the light of the current economic realities
-
This is not rocket science and you should be able to increase your returns and be in control of improving your returns
-
ETF’s are a very effective vehicle for implementing a SIB strategy and deliver excellent returns compared to the other funds selected
Symbols: AGG, BND, DBC, EEM, EFA, GSG, ICF, IYR, LQD, SPY, TLT, VEU, VNQ, VTI, VWO, VTSMX, VGTSX, VEIEX, VGSIX, VBMFX
Exchange Tickers: (NYSE: AGG), (NYSE: BND), (NYSE: DBC), (NYSE: EEM), (NYSE: EFA), (NYSE: GSG), (NYSE: ICF), (NYSE: IYR), (NYSE: LQD), (NYSE: SPY), (NYSE: TLT), (NYSE: VEU), (NYSE: VNQ), (NYSE: VTI), (NYSE: VWO), (NYSE: VTSMX), (NYSE:VGTSX), (NYSE:VEIEX), (NYSE:VGSIX), (NYSE:VBMFX)
Disclosure:MyPlanIQ does not have any business relationship with the company or companies mentioned in this article. It does not set up their retirement plans. The performance data of portfolios mentioned above are obtained through historical simulation and are hypothetical. -
- UPS, Fedex Square off in Retirement Plans
04/19/2011
The combination of a robust U.S. equity market and the proliferation of company-sponsored retirement plans helped push total assets in 401(k) pans over the $3 trillion threshold at close of last year, up 13% from 2009. The incidents in Japan, the Middle East and even as far back as New Orleans teach us the danger of living on borrowed time, the reactors, the governments the levees keeping things going -- just one more year. The temptation to delay until next time is very seductive until disaster strikes and the cost to repair, dwarfs the cost to prevent. Many working people put off their retirement investing -- just one more year until it becomes a "hair on fire" problem -- which it now is for baby boomers for whom retirement is a near and present danger.
The starting point for any retirement investing is the company provided retirement plan. Not all plans are created equal. Not all plans have the same number of choices, asset classes, quality of funds and, most importantly, risk adjusted returns.The list of minor asset classes covered by UPS Savings Plan The list of minor asset classes covered by Federal Express (FedEx) 401K Plan for Pilots Emerging Markets Bond: BAEDX
Foreign Large Blend: EFA
Inflation-protected Bond: BPRAX
Intermediate-term Bond: SSINX, SBMRX
Large Blend: SVSPX
Mid-cap Blend: MDY
Real Estate: VGSIX
Retirement Income: VTINX
Small Blend: IWM
Target Date 2000-2010: VTENX
Target Date 2011-2015: VTXVX
Target Date 2016-2020: VTWNX
Target Date 2021-2025: VTTVX
Target Date 2026-2030: VTHRX
Target Date 2031-2035: VTTHX
Target Date 2036-2040: VFORX
Target Date 2041-2045: VTIVX
Target Date 2050+: VFIFXConservative Allocation: VSCGX
Foreign Large Blend: VGTSX
Foreign Large Value: VTRIX
Inflation-protected Bond: VIPSX
Intermediate-term Bond: VBTIX
Large Blend: VIFSX
Large Value: VWNDX
Mid-cap Blend: VEMSX, VMISX
Moderate Allocation: VWELX, VSMGX
Retirement Income: VTINX
Small Blend: VSISX
Target Date 2000-2010: VTENX, VTOVX
Target Date 2011-2015: VTXVX
Target Date 2016-2020: VTWNX
Target Date 2021-2025: VTTVX
Target Date 2026-2030: VTHRX
Target Date 2031-2035: VTTHX
Target Date 2036-2040: VFORX
Target Date 2041-2045: VTIVX
Target Date 2050+: VFIFXAsset Class UPS Savings Plan Federal Express (FedEx) 401K Plan for Pilots REITs 1 0 Balanced Fund 10 14 Fixed Income 4 2 Sector Fund 0 0 Foreign Equity 1 2 US Equity 3 5 Other 0 0 Total 19 23 Fedex has more funds but have one less asset class -- UPS has REITs and Fedex does not. Neither company provides Emerging Markets or Commodity funds.
Both companies have a wide choice of Target Date funds which may appeal to some but are expensive and have mixed reviews as to their value for money.
It is interesting that UPS has emerging market bonds but no emerging ma
There are easy ways to improve these plans with emerging market and commodity exposure.As of Apr 18, 2011, UPS Savings Plan investment choice is rated as average and Federal Express (FedEx) 401K Plan for Pilots investment choice is rated as below average based on MyPlanIQ Plan Rating methodology that was designed to measure how effective a plan's available investment funds are . It has the following detailed ratings:
Attribute UPS Savings Plan Federal Express (FedEx) 401K Plan for Pilots Diversification above average (85%) below average (13%) Fund Quality below average (21%) average (47%) Portfolio Building above average (66%) below average (31%) Overall Rating average (58%) below average (31%)
Performance chart (as of Apr 18, 2011)Performance table (as of Apr 18, 2011)
Portfolio Name 1Yr AR 1Yr Sharpe 3Yr AR 3Yr Sharpe 5Yr AR 5Yr Sharpe UPS Savings Plan Tactical Asset Allocation Moderate 10% 77% 10% 102% 10% 98% UPS Savings Plan Strategic Asset Allocation Moderate 7% 55% 1% 9% 3% 11% Federal Express 401K Plan Tactical Asset Allocation Moderate 4% 39% 7% 73% 7% 69% Federal Express 401K Plan Strategic Asset Allocation Moderate 8% 87% 4% 36% 6% 41% Six Core Asset ETF Benchmark Tactical Asset Allocation Moderate 10% 71% 9% 73% 13% 91% Six Core Asset ETF Benchmark Strategic Asset Allocation Moderate 13% 103% 3% 20% 7% 35%
Currently Commodities, Real Estate and US Equity are doing well. US Equity and Real Estate available to UPS Savings Plan participants Only US Equities are available to FedEx participants.When we add the six asset class SIB benchmark to the table, it is possible to see how the two compare against a reference.
Takeaways
- The UPS plan with its extra asset class has a three point lead over the FedEx plan when comparing tactical asset allocation
- The Six asset class benchmark has a three point lead over the UPS plan when comparing tactical asset allocation
- The FedEx plan without the recent burden of the Real Estate crash beats UPS when comparing strategic asset allocation
- The Six asset class benchmark beats the FedEx plan over five years where emerging markets and commodities offset the drag of real estatewhen comparing strategic asset allocation
With either plan, augmenting a retirement portfolio with emerging market equities and commodities will provide better diversification and likely higher risk adjusted returns. As inflation seems like a near certainty, commodity exposure becomes increasingly important.
Disclosure:MyPlanIQ does not have any business relationship with the company or companies mentioned in this article. It does not set up their retirement plans. The performance data of portfolios mentioned above are obtained through historical simulation and are hypothetical.
Symbols: UPS, FDX, BAEDX, EFA, BPRAX, SSINX, SBMRX, SVSPX, MDY, VGSIX, VTINX, IWM, VGTSX, VTRIX, VIPSX, VBTIX, VIFSX, VWNDX, VEMSX, VMISX, VWELX, VSMGX, VTINX, VSISX, AGG, BND, VTI, VNQ, IYR, DBC, VWO, EEM, EFA
Exchange Tickers: (UPS), (FDX), (BAEDX), (EFA), (BPRAX ), (SSINX), (SBMRX), (SVSPX), (MDY), (VGSIX), (VTINX), (IWM), (VGTSX), (VTRIX), (VIPSX), (VBTIX), (VIFSX), (VWNDX), (VEMSX), (VMISX), (VWELX), (VSMGX), (VTINX), (VSISX), (AGG), (BND), (VTI), (VNQ), (IYR), (DBC), (VWO), (EEM), (EFA) - Armstrong's Informed Investor Lazy Portfolio Feels The Commodities Pain
04/18/2011
The incidents in Japan, the Middle East and even as far back as New Orleans teach us the danger of living on borrowed time, the reactors, the governments the levees keeping things going -- just one more year. The temptation to delay until next time is very seductive until disaster strikes and the cost to repair, dwarfs the cost to prevent. Many working people put off their retirement investing -- just one more year until it becomes a "hair on fire" problem -- which it now is for baby boomers for whom retirement is a near and present danger.
We continue to examine luminary portfolios to see what we can learn and use to further our investment portfolios.
Frank Armstrong, author of The Informed Investor, proposed this portfolio for an MSN Money article. The two key points of the portfolio are that it has four asset classes (US, International, REIT, Bonds) and relies on market indices rather than active management. The portfolio uses index funds because index funds eliminate manager risk. It overweights small-cap stocks as small-cap stocks have historically outperformed large caps stocks. The portfolio has a strong value tilt, based on the theory that, over the long haul, beaten-down stocks will perform better than high-flying growth stocks.
This should be a low cost, well performing portfolio.
The fund selection for testing the strategy is listed below with the ETF alternatives:
- 9.25% in Vanguard Small Cap Value VISVX (SCZ)
- 9.25% in Vanguard Value VIVAX (SPY, IYY)
- 6.25% in Vanguard Small-Cap Growth VISGX (VBK)
- 6.25% in Vanguard 500 Index VFINX (IVW)
- 31% in Vanguard Total International Stock VGTSX (EFA)
- 8% in Vanguard REIT VGSIX (IYR, VNQ, RWX)
- 30% in Vanguard Short-Term Bond VBISX (BND, AGG)
Things to note about the portfolio:
- This is designed as a lazy portfolio with limited rebalancing specified
- 31% in US equities is significant with a mix of large and small cap stocks
- With 70% in equities, this is a growth portfolio
- REIT is possibly underweighted
- There is no commodity asset class
The chart and table below show the historical performance of moderate model portfolios employing strategic and tactical asset allocation strategies. For comparison purpose, we also include the moderate model portfolios of a typical 6 asset SIB (Simpler Is Better) plan . This SIB plan has the following candidate index funds and their ETFs equivalent: US Equity: SPY or VTI
Commodity: DBC
Foreign Equity: EFA or VEU
REITs: IYR or VNQ or ICF
Emerging Market Equity: EEM or VWO
Fixed Income: AGG or BND
Portfolio Performance Comparison
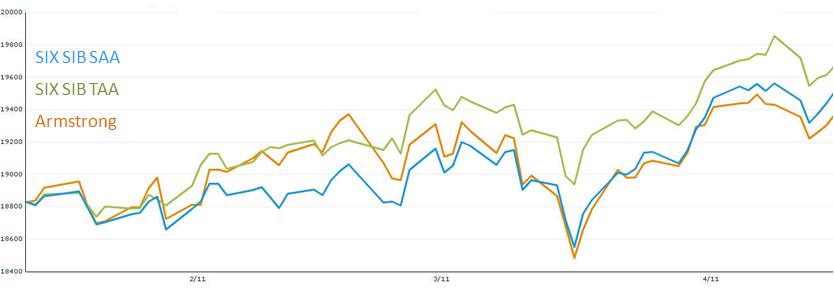
Portfolio/Fund Name 1Yr AR 1Yr Sharpe 3Yr AR 3Yr Sharpe 5Yr AR 5Yr Sharpe Armstrong Original 10% 66% 4% 17% 5% 20% Six Core Asset ETF Benchmark Tactical Asset Allocation Moderate 10% 71% 9% 73% 13% 91% Six Core Asset ETF Benchmark Strategic Asset Allocation Moderate 13% 103% 3% 20% 7% 35% A detailed comparison can be found here
Takeaways
-
2010 was a good year for lazy portfolios and as we continue through 2011while equities are still performing well, not having a commodities option hurts returns
-
TAA has benefits in terms of being able to stay away from some area such as European equities
-
Index funds continue to show good results against managed funds
-
Larger asset class plans have the benefit of stability and good returns
Disclosure: MyPlanIQ does not have any business relationship with the company or companies mentioned in this article. It does not set up their retirement plans. The performance data of portfolios mentioned above are obtained through historical simulation and are hypothetical.
Symbols: VISVX, SCZ, VIVAX, SPY, IYY, VISGX, VBK, VFINX, IVW, VGTSX, EFA, VGSIX, IYR, VNQ, RWX, BND, AGG, DBC, VEU, ICF, EEM, VWO - Bernstein No Brainer and Smart Money Lazy Portfolios Under The Microscope
04/15/2011
Retirement investing is now a "hair on fire" problem for Boomers who have no time to waste in getting their portfolios in order. The challenge is how to avoid being overwhelmed with conflicting data and shutting down.
We present simple approaches to understand the path to higher returns with lower risk.
Dr. William Bernstein is the author of the "Intelligent Asset Allocator" and "The Four Pillars of Investing." He's also a physician, neurologist and financial adviser to high-net-worth individuals. He has proposed a number of lazy portfolios. There are two that we now examine in the light of a more active benchmark which has monthly instead of annual rebalancing.
The no-brainer portfolio comprises the following fund allocation:
-
25% in Vanguard 500 Index VFINX (IVW)
-
25% in Vanguard Small Cap NAESX or VTMSX (VB)
-
25% in Vanguard Total International VGTSX or VTMGX (EFA, VEA)
-
25% in Vanguard Total Bond VBMFX or VBISX (BND)
Things to note about the portfolio:
-
Heavily weighted towards domestic equities
-
Similar to a three asset SIB [simpler-is-better] with domestic, international and fixed income
-
It would be better to have some REIT or emerging markets exposure
The smart money portfolio comprises the following fund allocation:-
40% Vanguard Short Term Investment Grade VFSTX (SCJ, SHY)
-
15% Vanguard Total Stock Market VTSMX (VTI)
-
10% Vanguard Small Cap Value VISVX (VBR)
-
10% Vanguard Value Index VIVAX (VTV)
-
5% Vanguard Emerging Markets Stock VEIEX (VWO)
-
5% Vanguard European Stock VEURX (VEU)
-
5% Vanguard Pacific Stock VPACX (VPL)
-
5% Vanguard Small Cap Value NAESX or VTMSX (VB)
To summarize:
-
40% in U.S. equities
-
10% in international equities
-
5% in emerging market equities
-
5% in REITs
-
40% in fixed income
The smart money portfolio is more conservative and has two more asset classes but they only represent five percent of the portfolio each. With 80% of the portfolio in US and fixed income, it isn't very different from the no brainer portfolio.
We are going to use the SIB (Simpler Is Better) Portfolio as a benchmark. The SIB comprise – market index funds (ETFs or Mutual Funds) from key asset classes that can be used to measure historical returns to show the impact of asset class selection rather than fund or stock selection. We are going to use a six asset ETF SIBs. This will enable us to see the type of returns we can expect and contrast Mutual Funds and ETFsThe following funds are used:
Asset Class Ticker Name LARGE BLEND VTI Vanguard Total Stock Market ETF Foreign Large Blend VEU Vanguard FTSE All-World ex-US ETF DIVERSIFIED EMERGING MKTS VWO Vanguard Emerging Markets Stock ETF REAL ESTATE VNQ Vanguard REIT Index ETF COMMODITIES BROAD BASKET DBC PowerShares DB Commodity Idx Trking Fund Intermediate-Term Bond BND Vanguard Total Bond Market ETF The strategic asset allocation strategy has 40% in fixed income and 12% in the other five funds.
The tactical asset allocation strategy has 40% in fixed income and 30% in the top two asset class funds determined by the price momentum -- unless that performance is below fixed income when the money will be diverted to fixed income. If fixed income is performing below cash, the fixed income portion will be cash.Portfolio Analysis
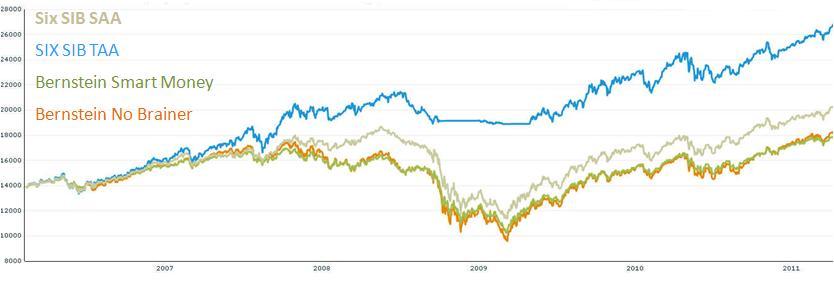
Portfolio Performance Comparison
Portfolio/Fund Name 1Yr AR 1Yr Sharpe 3Yr AR 3Yr Sharpe 5Yr AR 5Yr Sharpe P William Bernstein No Brainer Nine Fund Portfolio Annual Rebalance 8% 79% 4% 20% 4% 21% P William Bernstein No Brainer Four Fund Portfolio 11% 87% 4% 18% 5% 19% Six Core Asset ETF Benchmark Tactical Asset Allocation Moderate 10% 71% 9% 73% 13% 91% Six Core Asset ETF Benchmark Strategic Asset Allocation Moderate 13% 103% 4% 20% 7% 35% Takeaways
- Both Bernstein portfolios perform satisfactorily for a lazy portfolio – it is surprising that the no-brainer performs so well against its more diversified smart-money cousin
- The Six Asset SIB buy and hold outperforms both Bernstein portfolios based on broader diversification.
- Tactical Asset Allocation reduces downside risk and that wins in the current uncertain environment
Symbols: BND, DBC, EFA, IVW, NAESX, RWX, SCJ, SHY, VB, VBR, VEA, VEIEX, VEU, VEURX, VFINX, VFSTX, VGSIX, VISVX, VIVAX, VNQ, VPACX, VPL, VTI, VTMGX, VTMSX, VTSMX, VTV, VWO
Disclosure:
MyPlanIQ does not have any business relationship with the company or companies mentioned in this article. It does not set up their retirement plans. The performance data of portfolios mentioned
-
- Investing with Styles Can Pay off
07/09/2010
Portfolio construction consists of the following steps
- Decide personal risk profile which determines the target allocation in risk assets.
- Decide asset allocation method: strategic or tactical or both (strategic does not change target asset allocations while tactical can alter allocations more actively)
- Decide target allocation for each asset in a strategic asset allocation
- Periodically rebalancing portfolios
For a portfolio using strategic asset allocation, with long term target allocation being fixed (and only changed when major events such as approaching to retirement and children college education spending, for example), one can further enhance a portfolio return and reduce the risk by rebalancing and fund selection in an asset class. It is reported that adopting proper timing and way to rebalance a portfolio can improve return and reduce risk (see Daryanani opportunitstic rebalancing article). In this article, we focus on fund selection.
In a well designed portfolio for retirement plans (401K or IRA), it is a popular practice to have funds with various style exposures. In a stock/equity asset, a fund style is defined as value style (growth/blend/value) and size style (large/mid/small cap). The Morningstar 9 boxes of styles are essentially the combinations of the 3 value and 3 size styles. In a fixed income asset, a fund style is a combination of credit risk (junk/investment grade) and interest rate risk (short/intermediate/long) for corporate bonds or a just interest rate risk for treasury bonds. In an actively managed portfolio, it is a well recognized and widely practiced method to select funds based on style rotation to improve a portfolio alpha or return. For example, in an article published in Journal of Asset Management (May, 2007), B. Arshanapalli , L. Switzer and K. Panju concluded that active multi-style rotation strategies can be devised to outperform the best performing buy-and-hold portfolio.
MyPlanIQ maintains an index fund based plan or an ETF based plan using candidate funds based on those in a lazy portfolio proposed by Fund Advice Paul Merriman and maintained by MarketWatch.com (called Fund Advice Ultimate Buy and Hold Portfolio) (see here for the independently tracked portfolio on MyPlanIQ.com). The candidate funds and the original allocation are as follows
Index ETF Allocation Vanguard Interm-Tm Trs (VFITX) iShares 3-7 Year Treasury (IEI) 20% Vanguard Short-Tm Trs(VFISX) iShares 3-7 Year Treasury (SHY) 12% Vanguard Intl Val (VTRIX) iShares MSCI EAFE Value Index (EFV) 12% Vanguard Dev Mkts (VDMIX) iShares MSCI EAFE Index (EFA) 12% Vanguard Inflation-Prot (VIPSX) iShares TIPS Bond (TIP) 8% Vanguard Small-Cap Idx (NAESX) iShares Russell 2000 Index (IWM) 6% Vanguard Small-Cap Val (VISVX) iShares Russell 2000 Value Index (IWN) 6% Vanguard Value Idx (VIVAX) iShares Russell 3000 Value Index (IWW) 6% Vanguard 500 Index (VFINX) SPDR S&P 500 (SPY) 6% Vanguard Emerging Mkt (VEIEX) iSharess Emerging Market Stock (EEM) 6% Vanguard REIT Idx (VGSIX) iShares Dow Jones REIT Index (IYR) 6% The funds cover five asset classes: U.S. Equity, International Equity, Emerging Mkt Equity, U.S. REIT and Fixed Income. They have various style exposures for U.S. stock market (equity), International Stocks and Fixed income.
MyPlanIQ Strategic Asset Allocation (SAA) selects funds with the best risk adjusted returns for each asset class when rebalancing. The following table compares the Strategic Asset Allocation (SAA) moderate portfolios in both index fund and ETF plans as well as the original portfolio (both MyPlanIQ SAA moderate portfolios have 40% allocation in fixed income). We also include the strategic asset allocation moderate portfolio in MyPlanIQ Five Core Asset ETF Plan that consists one fund for each asset class.
As of 7/2/2010
Portfolio 1 Yr Return 3 Yr Return 5 Yr Return Since 12/2000 FundAdvice SAA Moderate Index Funds 17% -1.0% 5.1% 7.4% FundAdvice SAA Moderate ETF 16.7% -2.2% 4.8% 7% FundAdvice Buy and Hold Index Funds 14.5% -2.4% 4.1% 5.7% Five Core SAA Moderate 16.9% -3.4% 3.93% 5.6% From the above table, we can observe:
- Diversification over styles improves return (FundAdvice Buy and Hold vs. Five Core SAA Moderate).
- Style rotation adds 1.3-1.7% returns over buy and hold (SAA Moderate ETF or Index Funds vs. FundAdvice Buy and Hold).
The above observations are consistent across thousands of plans MyPlanIQ maintains. We should also point out that better fund/style selection does not alter the overall portfolio risk allocation, which is a major advantage over an actively managed tactical asset allocation portfolio.
At the moment, for U.S. stocks, MyPlanIQ SAA favors small cap (IWM), small cap value (IWN). For fixed income, it favors Inflation-protected treasury (TIP).
labels:investments,IRA,401K,
Symbols:vti,spy,veu,efa,vwo,eem,iyr,icf,vnq,dbc,gsg,bnd,agg,tlt,lqd,tip,iwb,oef,iwd,iwo,iwm,ijr,iwn,iwp,iwr,ijh,iws,dvy,iwc,efv,iww,iwv,iwz,VFITX,VFISX,VTRIX,VDMIX,VIPSX,NAESX,VISVX,VIVAX,VFINX,VEIEX,VGSIX,
- Understanding and Building Your ETF Portfolio
06/27/2010
- David Swensen's Six Asset Investment Plan
06/09/2010
- Apple 401K Report On 06/01/2011
06/01/2011
This article is part of a series of case studies we are conducting for various 401K plans. In this article, we will discuss how participants in Apple 401K can achieve reasonable investment results using asset allocation strategies. We will also discuss how those portfolios are positioned in today’s market environment.
Apple Inc., (Ticker: AAPL) together with subsidiaries, designs, manufactures, and markets personal computers, mobile communication devices, and portable digital music and video players, as well as sells various related software, services, peripherals, and networking solutions. The company sells its products worldwide through its online stores, retail stores, direct sales force, third-party wholesalers, resellers, and value-added resellers. In addition, it sells various third-party Macintosh, iPhone, and iPod compatible products, including application software, printers, storage devices, speakers, headphones, and various other accessories and peripherals through its online and retail stores, and digital content and applications through the iTunes Store. The company sells its products to consumer, small and mid-sized business, education, enterprise, government, and creative customers. As of September 26, 2009, it had 273 retail stores, including 217 stores in the United States and 56 stores internationally. The company, formerly known as Apple Computer, Inc., was founded in 1976 and is headquartered in Cupertino, California.
Apple offers generous benefits to its employees. It was the first high tech company in Bay Area that offered free day care for employees' children.
Apple 401K's 401K plan consists of 14 funds. These funds enable participants to gain exposure to 4 major assets: US Equity, Foreign Equity, REITs, Fixed Income. Four Core Asset Index Funds REITs's 401K plan consists of funds. These funds enable participants to gain exposure to 4 major assets: US Equity, Foreign Equity, REITs, Fixed Income.
The list of minor asset classes covered by Apple 401K The list of minor asset classes covered by Four Core Asset Index Funds REITs Asset Class Apple 401K Four Core Asset Index Funds REITs Total 14
As of May 27, 2011, Apple 401K investment choice is rated as average and Four Core Asset Index Funds REITs investment choice is rated as based on MyPlanIQ Plan Rating methodology that was designed to measure how effective a plan's available investment funds are . It has the following detailed ratings:
Attribute Apple 401K Four Core Asset Index Funds REITs Diversification above average (85%) Fund Quality below average (15%) No Rating Portfolio Building average (59%) No Rating Overall Rating average (54%) No Rating
The chart and table below show the historical performance of moderate model portfolios employing strategic and tactical asset allocation strategies (SAA and TAA , both provided by MyPlanIQ). For comparison purpose, we also include the moderate model portfolios of a typical 4 asset SIB (Simpler Is Better) plan . This SIB plan has the following candidate index funds and their ETFs equivalent:
US Equity: SPY or VTI
Foreign Equity: EFA or VEU
REITs: IYR or VNQ or ICF
Fixed Income: AGG or BND
Performance chart (as of May 27, 2011)Performance table (as of May 27, 2011)
Portfolio Name 1Yr AR 1Yr Sharpe 3Yr AR 3Yr Sharpe 5Yr AR 5Yr Sharpe Apple 401K Tactical Asset Allocation Moderate 12% 159% 9% 122% 9% 99% Apple 401K Strategic Asset Allocation Moderate 14% 225% 4% 27% 5% 32% Four Core Asset Index Funds REITs Tactical Asset Allocation Moderate 10% 88% 8% 81% 10% 85% Four Core Asset Index Funds REITs Strategic Asset Allocation Moderate 17% 158% 4% 19% 6% 24% Currently are doing well. But these asset classes are not available to Apple 401K participants.
To summarize, Apple 401K plan participants can achieve reasonable investment returns by adopting asset allocation strategies that are tailored to their risk profiles. Currently, the tactical asset allocation strategy indicates overweighing on Foreign Equity, REITs and Fixed Income funds.
Disclosure:MyPlanIQ does not have any business relationship with the company or companies mentioned in this article. It does not set up their retirement plans. The performance data of portfolios mentioned above are obtained through historical simulation and are hypothetical.
Symbols:AAPL, CASH, VBMFX, LHYZX, FBAKX, FGRIX, FMGKX, VITPX, VITSX, NAESX, FCNTX, RGRYX, VGTSX, VDMIX, TAREX, VTSMX, VGSIX
Exchange Tickers: (AAPL), (CASH), (VBMFX), (LHYZX), (FBAKX), (FGRIX), (FMGKX), (VITPX), (VITSX), (NAESX), (FCNTX), (RGRYX), (VGTSX), (VDMIX), (TAREX), (VTSMX), (VGSIX) - Ford Motor 401K Report On 06/01/2011
06/01/2011