 |
Vanguard ETF: |  |
7.4%* |
|
Diversified Core: | |
8.1%* |
|
Six Core Asset ETFs: | |
7.3%* |
Articles on VEA
- Foreign Large Cap Equities Deliver Strong Returns Among Dividend Stock ETFs
05/04/2011
Foreign Large Cap Equity ETFs allow investors to diversify their portfolios by gaining exposure large stocks in developed economies across the globe. These ETFs track equities from nations like Japan, the UK, and Germany, among many others. These ETFs invest primarily in stocks with market caps in the top 70% of their respective markets.
Among Dividend Stock ETFs (see table), those that track Foreign Large Cap Equities performed very well in the past week, continuing their string performance over the past 52 weeks.. The iShares Dow Jones International Select Dividend ETF (IDV) returned 2.81% in the past week and over 28% in the past 52 weeks. Also performing well among Dividend Stock ETFs was the iShares MSCI EAFE Index ETF (EFA), which gained 2.69% in the last week and almost 18% during the past year.
Top Dividend Stock ETF Trends
4/29/2011
ETF Name Symbol 1 Week 4 Weeks SPDR DJ Wilshire Intl Real Estate RWX 2.98% 5.22% iShares Dow Jones Intl Select Div Idx IDV 2.81% 6.02% iShares MSCI EAFE Index EFA 2.69% 4.90% iShares Dow Jones US Real Estate IYR 2.62% 4.78% First Trust Value Line Dividend Index FVD 1.93% 3.15% SPDR S&P 500 SPY 1.93% 2.18% iShares Dow Jones Select Dividend Index DVY 1.89% 2.32% Vanguard High Dividend Yield Indx VYM 1.84% 3.27% PowerShares Intl Dividend Achievers PID 1.81% 4.28% PowerShares HighYield Dividend Achievers PEY 1.73% 1.78% The growth of these ETFs has followed an upward trend in the overall equity market in recent periods. As a higher percentage of the world's equity market capitalization continues to shift away from the United States, Foreign Large Cap Equities will continue to bring strong returns to investors.
Foreign Large Cap Equities
04/29/2011Description Symbol 1 Yr 3 Yr 5 Yr Avg. Volume(K) 1 Yr Sharpe iShares MSCI EAFE Index EFA 16.26% -3.93% 0.58% 17,665 68.32% Vanguard MSCI EAFE ETF VEA 21.49% -0.87% NA 2,135 88.16% Schwab International Equity SCHF 19.65% NA NA 180 86.62% iShares Dow Jones Intl Select IDV 26.81% 1.73% NA 156 107.04% iShares MSCI EAFE Value Index EFV 14.36% -4.8% -1.08% 133 55.66% PowerShares Intl Dividend Achievers PID 20.98% -1.56% 2.87% 121 112.83% iShares MSCI EAFE Growth Index EFG 19.53% -2.71% 1.55% 84 86.67% PowerShares DWA Dev Mkts Techn PIZ 22.65% -0.49% NA 115 93.38% In addition to the ETFs mentioned above, others in the Foreign Large Cap sector have shown strong growth in recent periods. The PowerShares DWA Developed Markets Technical ETF has returned 22.65% in the past year and the Vanguard MSCI EAFE ETF (VEA) gained 21.49% during the same period. These strong gains have helped to offset the large valuation declines experience during the recent financial crisis.
While high equity valuations may trigger a market retraction in coming periods, Foreign Large Cap Equity ETFs should remain a substantial part of any well-diversified portfolio.
Symbols: EFA, VEA, SCHF, IDV, EFV, PID, EFG, PIZ, RWX, IDV, EFA, IYR, FVD, SPY, DVY, VYM, PEY
Disclosure: MyPlanIQ does not have any business relationship with the company or companies mentioned in this article. It does not set up their retirement plans. The performance data of portfolios mentioned above are obtained through historical simulation and are hypothetical.
- REIT and Commodities In Simple Six Fund Portfolio Shows Up Aronson's Lazy Portfolio
04/20/2011
The incidents in Japan, the Middle East and even as far back as New Orleans teach us the danger of living on borrowed time, the reactors, the governments the levees keeping things going -- just one more year. The temptation to delay until next time is very seductive until disaster strikes and the cost to repair, dwarfs the cost to prevent. Many working people put off their retirement investing -- just one more year until it becomes a "hair on fire" problem -- which it now is for baby boomers for whom retirement is a near and present danger.
We continue to examine luminary portfolios to see what we can learn and use to further our investment portfolios.
Ted Aronson and his AJO Partners manage about $25 billion of institutional assets. Aronson puts his family's taxable money in this well-diversified portfolio of no-load index funds.
Fund Weight Ticker ETF US Equities 40% VFINX, VEXMX, VISGX, VTSMX, VISXX VTI, TMW, VBK, VBR International Equity 20% VPACX, VEURX VEA Emerging Markets 10% VEIEX EEM US Bonds 30% VIPSX, VUSTX, VWEHX TIP, LQD, HYG
This is a well diversified four asset class portfolio with an aggressive profile. The US equities are broadly diversified. Asia Pacific is put above Europe for developed markets. There is a diversified set of fixed income with VWEHX and VUSTX being relatively high risk. The long term treasury bond has proved to be a good diversifier in recent history -- today all bonds are under pressure so this may be less true.
The US component is possibly over-weighted and emerging markets could be increased or, even better, some real estate assets could be added.This portfolio was last reviewed at the end of the year and we now re-examine performance over the last three months as we see markets changing and inflation becoming more of a present reality.
This lazy portfolio will be compared with six asset class SIB to examine the returns of four and six asset class portfolios
Portfolio Performance Comparison
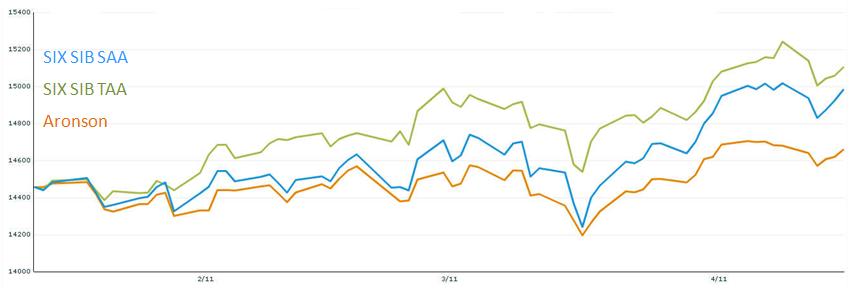
Portfolio/Fund Name 1Yr AR 1Yr Sharpe 3Yr AR 3Yr Sharpe 5Yr AR 5Yr Sharpe Aronson Original 6% 74% 2% 14% 3% 16% Six Core Asset ETF Benchmark Tactical Asset Allocation Moderate 10% 71% 9% 73% 13% 91% Six Core Asset ETF Benchmark Strategic Asset Allocation Moderate 13% 103% 3% 20% 7% 35% full comparison
The Aronson portfolio has four asset classes missing out on REIT and commodities. The performance over the last five years has not been exceptional with the Simple SIB able to beat it across the board.Over the last three months, REIT and commodities have been in favor and having neither has had an impact on the Aronson returns.Takeaways- The Aronson lazy portfolio has moderate returns that can be beaten
- Having broader diversification pays off as market conditions change
- ETFs can readily be used to implement these portfolios with good performance
- A 10% spread over five years means that it’s worth looking at alternatives
Disclosure:MyPlanIQ does not have any business relationship with the company or companies mentioned in this article. It does not set up their retirement plans. The performance data of portfolios mentioned above are obtained through historical simulation and are hypothetical.The incidents in Japan, the Middle East and even as far back as New Orleans teach us the danger of living on borrowed time, the reactors, the governments the levees keeping things going -- just one more year. The temptation to delay until next time is very seductive until disaster strikes and the cost to repair, dwarfs the cost to prevent. Many working people put off their retirement investing -- just one more year until it becomes a "hair on fire" problem -- which it now is for baby boomers for whom retirement is a near and present danger.
Exchange Tickers: (NYSE: VFINX), (NYSE: VEXMX), (NYSE: VISGX), (NYSE: VTSMX), (NYSE: VISXX), (NYSE: VTI), (NYSE: TMW), (NYSE: VBK), (NYSE: VBR), (NYSE: VPACX), (NYSE: VEURX), (NYSE: VEA), (NYSE: VEIEX), (NYSE: EEM), (NYSE: VIPSX), (NYSE: VUSTX), (NYSE: VWEHX), (NYSE: TIP), (NYSE: LQD), (NYSE: HYG)
- REIT and Commodities In Simple Six Fund Portfolio Shows Up Aronson's Lazy Portfolio
04/19/2011
The incidents in Japan, the Middle East and even as far back as New Orleans teach us the danger of living on borrowed time, the reactors, the governments the levees keeping things going -- just one more year. The temptation to delay until next time is very seductive until disaster strikes and the cost to repair, dwarfs the cost to prevent. Many working people put off their retirement investing -- just one more year until it becomes a "hair on fire" problem -- which it now is for baby boomers for whom retirement is a near and present danger.
We continue to examine luminary portfolios to see what we can learn and use to further our investment portfolios.
Ted Aronson and his AJO Partners manage about $25 billion of institutional assets. Aronson puts his family's taxable money in this well-diversified portfolio of no-load index funds.
Fund Weight Ticker ETF US Equities 40% VFINX, VEXMX, VISGX, VTSMX, VISXX VTI, TMW, VBK, VBR International Equity 20% VPACX, VEURX VEA Emerging Markets 10% VEIEX EEM US Bonds 30% VIPSX, VUSTX, VWEHX TIP, LQD, HYG
This is a well diversified four asset class portfolio with an aggressive profile. The US equities are broadly diversified. Asia Pacific is put above Europe for developed markets. There is a diversified set of fixed income with VWEHX and VUSTX being relatively high risk. The long term treasury bond has proved to be a good diversifier in recent history -- today all bonds are under pressure so this may be less true.
The US component is possibly over-weighted and emerging markets could be increased or, even better, some real estate assets could be added.This portfolio was last reviewed at the end of the year and we now re-examine performance over the last three months as we see markets changing and inflation becoming more of a present reality.
This lazy portfolio will be compared with six asset class SIB to examine the returns of four and six asset class portfolios
Portfolio Performance Comparison
Portfolio/Fund Name 1Yr AR 1Yr Sharpe 3Yr AR 3Yr Sharpe 5Yr AR 5Yr Sharpe Aronson Original 6% 74% 2% 14% 3% 16% Six Core Asset ETF Benchmark Tactical Asset Allocation Moderate 10% 71% 9% 73% 13% 91% Six Core Asset ETF Benchmark Strategic Asset Allocation Moderate 13% 103% 3% 20% 7% 35% full comparison
The Aronson portfolio has four asset classes missing out on REIT and commodities. The performance over the last five years has not been exceptional with the Simple SIB able to beat it across the board.Over the last three months, REIT and commodities have been in favor and having neither has had an impact on the Aronson returns.Takeaways- The Aronson lazy portfolio has moderate returns that can be beaten
- Having broader diversification pays off as market conditions change
- ETFs can readily be used to implement these portfolios with good performance
- A 10% spread over five years means that it’s worth looking at alternatives
Disclosure:MyPlanIQ does not have any business relationship with the company or companies mentioned in this article. It does not set up their retirement plans. The performance data of portfolios mentioned above are obtained through historical simulation and are hypothetical.The incidents in Japan, the Middle East and even as far back as New Orleans teach us the danger of living on borrowed time, the reactors, the governments the levees keeping things going -- just one more year. The temptation to delay until next time is very seductive until disaster strikes and the cost to repair, dwarfs the cost to prevent. Many working people put off their retirement investing -- just one more year until it becomes a "hair on fire" problem -- which it now is for baby boomers for whom retirement is a near and present danger.Symbols: VFINX, VEXMX, VISGX, VTSMX, VISXX, VTI, TMW, VBK, VBR, VPACX, VEURX, VEA, VEIEX, EEM, VIPSX, VUSTX, VWEHX, TIP, LQD, HYG - Bernstein No Brainer and Smart Money Lazy Portfolios Under The Microscope
04/15/2011
Retirement investing is now a "hair on fire" problem for Boomers who have no time to waste in getting their portfolios in order. The challenge is how to avoid being overwhelmed with conflicting data and shutting down.
We present simple approaches to understand the path to higher returns with lower risk.
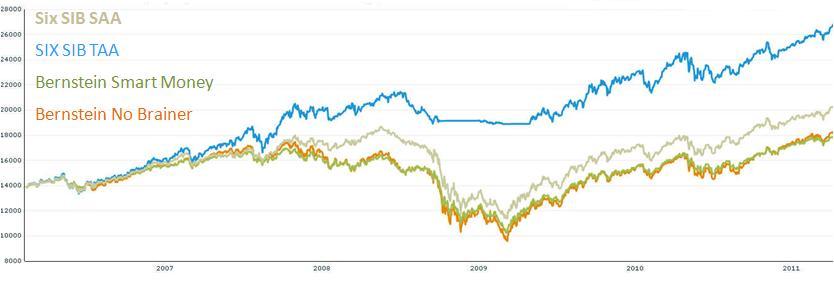
Dr. William Bernstein is the author of the "Intelligent Asset Allocator" and "The Four Pillars of Investing." He's also a physician, neurologist and financial adviser to high-net-worth individuals. He has proposed a number of lazy portfolios. There are two that we now examine in the light of a more active benchmark which has monthly instead of annual rebalancing.
The no-brainer portfolio comprises the following fund allocation:
-
25% in Vanguard 500 Index VFINX (IVW)
-
25% in Vanguard Small Cap NAESX or VTMSX (VB)
-
25% in Vanguard Total International VGTSX or VTMGX (EFA, VEA)
-
25% in Vanguard Total Bond VBMFX or VBISX (BND)
Things to note about the portfolio:
-
Heavily weighted towards domestic equities
-
Similar to a three asset SIB [simpler-is-better] with domestic, international and fixed income
-
It would be better to have some REIT or emerging markets exposure
The smart money portfolio comprises the following fund allocation:-
40% Vanguard Short Term Investment Grade VFSTX (SCJ, SHY)
-
15% Vanguard Total Stock Market VTSMX (VTI)
-
10% Vanguard Small Cap Value VISVX (VBR)
-
10% Vanguard Value Index VIVAX (VTV)
-
5% Vanguard Emerging Markets Stock VEIEX (VWO)
-
5% Vanguard European Stock VEURX (VEU)
-
5% Vanguard Pacific Stock VPACX (VPL)
-
5% Vanguard Small Cap Value NAESX or VTMSX (VB)
To summarize:
-
40% in U.S. equities
-
10% in international equities
-
5% in emerging market equities
-
5% in REITs
-
40% in fixed income
The smart money portfolio is more conservative and has two more asset classes but they only represent five percent of the portfolio each. With 80% of the portfolio in US and fixed income, it isn't very different from the no brainer portfolio.
We are going to use the SIB (Simpler Is Better) Portfolio as a benchmark. The SIB comprise – market index funds (ETFs or Mutual Funds) from key asset classes that can be used to measure historical returns to show the impact of asset class selection rather than fund or stock selection. We are going to use a six asset ETF SIBs. This will enable us to see the type of returns we can expect and contrast Mutual Funds and ETFsThe following funds are used:
Asset Class Ticker Name LARGE BLEND VTI Vanguard Total Stock Market ETF Foreign Large Blend VEU Vanguard FTSE All-World ex-US ETF DIVERSIFIED EMERGING MKTS VWO Vanguard Emerging Markets Stock ETF REAL ESTATE VNQ Vanguard REIT Index ETF COMMODITIES BROAD BASKET DBC PowerShares DB Commodity Idx Trking Fund Intermediate-Term Bond BND Vanguard Total Bond Market ETF The strategic asset allocation strategy has 40% in fixed income and 12% in the other five funds.
The tactical asset allocation strategy has 40% in fixed income and 30% in the top two asset class funds determined by the price momentum -- unless that performance is below fixed income when the money will be diverted to fixed income. If fixed income is performing below cash, the fixed income portion will be cash.Portfolio Analysis
Portfolio Performance Comparison
Portfolio/Fund Name 1Yr AR 1Yr Sharpe 3Yr AR 3Yr Sharpe 5Yr AR 5Yr Sharpe P William Bernstein No Brainer Nine Fund Portfolio Annual Rebalance 8% 79% 4% 20% 4% 21% P William Bernstein No Brainer Four Fund Portfolio 11% 87% 4% 18% 5% 19% Six Core Asset ETF Benchmark Tactical Asset Allocation Moderate 10% 71% 9% 73% 13% 91% Six Core Asset ETF Benchmark Strategic Asset Allocation Moderate 13% 103% 4% 20% 7% 35% Takeaways
- Both Bernstein portfolios perform satisfactorily for a lazy portfolio – it is surprising that the no-brainer performs so well against its more diversified smart-money cousin
- The Six Asset SIB buy and hold outperforms both Bernstein portfolios based on broader diversification.
- Tactical Asset Allocation reduces downside risk and that wins in the current uncertain environment
Symbols: BND, DBC, EFA, IVW, NAESX, RWX, SCJ, SHY, VB, VBR, VEA, VEIEX, VEU, VEURX, VFINX, VFSTX, VGSIX, VISVX, VIVAX, VNQ, VPACX, VPL, VTI, VTMGX, VTMSX, VTSMX, VTV, VWO
Disclosure:
MyPlanIQ does not have any business relationship with the company or companies mentioned in this article. It does not set up their retirement plans. The performance data of portfolios mentioned
-
- Swensen Six Asset Lazy Portfolio Review Exhibits Different Q1 Behavior
03/19/2011
In the last article, we looked over the prior year's returns for the Swensen Six Lazy Portfolio. David Swensen, the Yale Endowment Investment Manager, proposed this portfolio for individual investors.
- 30% in Vanguard Total Stock Market Index (MUTF: VTSMX) ), (NYSE: VTI)
- 20% in Vanguard REIT Index (MUTF: VGSIX), (NYSE: VNQ)
- 20% in Vanguard Total International Stock (MUTF: VGTSX) or 15% in (VGTSX) and 5% in (MUTF: VEIEX), (NYSE: VEU), (NYSE: VWO), (NYSE: VEA)
- 15% in Vanguard Inflation Protected Securities (MUTF: VIPSX), (NYSE: TIP)
- 15% in Vanguard Long Term Treasury Index (MUTF: VUSTX), (NYSE: LQD)
We made one year comparisons between
- The original Swensen funds with an annual rebalance. Swensen himself performs a daily rebalance but that is too onerous for the general user
- The original Swensen funds with a quarterly rebalance. Normal protocal for advisors is to have a quarterly review of a portfolio and that is what this is
- The Swensen funds with the MyPlanIQ strategic asset allocation for a moderate portfolio, 40% bonds 20% in each of the other three asset classes
- The Swensen funds with the MyPlanIQ tactical asset allocation for a moderate portfolio, 40% bonds 30% in each of the top two asset classes or moved to fixed income (including cash)
- The Six Core Asset ETF Benchmark
Portfolio Performance Comparison
Portfolio Name 1Yr AR 1Yr Sharpe 3Yr AR 3Yr Sharpe 5Yr AR 5Yr Sharpe David Swensen Six Asset Individual Investor Plan Strategic Asset Allocation Moderate 9% 109% 4% 21% 6% 31% David Swensen Six Asset Individual Investor Plan Tactical Asset Allocation Moderate 9% 100% 8% 75% 11% 83% P David Swensen Yale Individual Investor Portfolio Annual Rebalancing 14% 110% 5% 22% 5% 22% P David Swensen Yale Individual Investor Portfolio Quarterly Rebalancing 15% 115% 5% 21% 5% 20% Six Core Asset ETF Benchmark Tactical Asset Allocation Moderate 12% 86% 8% 65% 13% 88%
We now drill down into the first quarter of 2011 to see where differing market conditions test the portfolio's performance. As we come to the end of the QEII program, we expect to see pressure on fixed income. PIMCO recently moved more heavily into cash and fixed income has been under pressure in general for a couple of quarters. In addition, with inflation becoming a reality in the emerging world, the lack of commodities could result in a drop in returns.We previously noted that the buy and hold portfolios outperformed the momentum portfoilos over the past year. However, as we look into the end of that year (March 2010 - March 2011), we see a different picture emerging. There are a lot of moving parts as the fixed income segment is under a lot of pressure which is only exacerbated by the end of QEII. Inflation is making commodities more desirable followed by real estate and US Equities.
By looking at the current Major Asset Class Trends (note that we include Gold even though it isn't a major asset trend in its own right) we can see that Commodities are clearly leading the field. Real Estate and US Equities are running neck and neck and fixed income is at the bottom of the table.
Major Asset Classes Trend
03/11/2011
Description Symbol 1 Week 4 Weeks 13 Weeks 26 Weeks 52 Weeks Trend Score Commodities DBC -3.09% 2.93% 12.39% 27.11% 25.38% 12.94% Gold GLD -0.81% 4.46% 2.08% 13.55% 28.04% 9.46% US Stocks VTI -1.42% -1.83% 6.16% 20.86% 16.39% 8.03% US Equity REITs VNQ 0.03% -1.17% 7.18% 11.52% 22.59% 8.03% International REITs RWX -2.38% 0.62% 3.97% 12.27% 19.95% 6.89% Emerging Market Stks VWO -2.15% 0.96% -0.17% 10.17% 14.38% 4.64% US High Yield Bonds JNK -0.52% 0.13% 4.14% 7.46% 9.42% 4.13% International Treasury Bonds BWX -0.23% 2.98% 4.84% 6.29% 6.33% 4.04% International Developed Stks EFA -3.09% -2.45% 2.97% 12.37% 6.61% 3.28% US Credit Bonds CFT 0.57% 1.48% 1.49% -0.3% 5.3% 1.71% Emerging Mkt Bonds PCY 0.65% 1.93% -1.05% -1.84% 6.23% 1.18% Intermediate Treasuries IEF 0.71% 2.07% 0.2% -2.75% 5.59% 1.16% Frontier Market Stks FRN -0.59% -0.99% -9.1% -0.5% 16.21% 1.01% Total US Bonds BND 0.55% 1.57% 0.56% -0.72% 2.92% 0.97% Mortgage Back Bonds MBB 0.47% 1.64% 0.46% -2.36% 0.41% 0.12% Treasury Bills SHV 0.04% 0.03% 0.04% 0.06% 0.09% 0.05% Municipal Bonds MUB -0.08% -0.58% 1.34% -5.02% -1.76% -1.22% Comparing the different plans, they each have slightly different properties
- The two original Swensen plans will only rebalance, there is no notion of rotating funds -- with the simplicity of the plan, this only makes sense with the fixed income portion
- The Swensen plan with TAA and SAA do have the ability to rotate fixed income funds into cash or each other with a 90 day redemption period restriction
- The Benchmark has commodities and the ability to rotate funds into cash with a 30 day redemption period
Currently
- The Six Asset Benchmark has moved all the fixed income to cash and has the risk assets in real estate and commodities.
- The Swensen TAA is in cash Real Estate and US Equities
- The Swensen SAA has 15% in cash and 15% in inflation protected (TIP, VIPSX), the balance distributed over US, international and Real Estate
The takeaways from the last quarter's review are:- Equities have still been doing well so that the buy and hold of the original Swensen portfolio with only 30% in fixed income is doing well
- The benchmark still trumps the original portfolio based on exposure to Commodities and the ability to move out of fixed income into cash
- The Swensen TAA and SAA portfolios are weighed down by extra fixed income exposure and not access to commodities as well as not being able to quickly move in and out of sub-classes with a 90 day holding period
Our contention is, for those who are serious about optimizing their long term investments, that you have to be involved. A lazy portfolio is appealing because you can "fire and forget" with only quarterly adjustments. However, if you want more out of your investments and you accept that conditions will change, then a portfolio with monthly adjustments is more likely to give you better returns. It's our contention that a monthly review (not necessarily requiring action every month), is about the right frequency.Symbols:VTI,VEU,BND,VNQ,VWO,DBC,VEA,TIP,LQD,BND,EFA,PTTRX,PTTDX,RSP,VBK,IJJ,RWR,RWO,(NYSEArca,VTI,),(NYSEArca,VEU),(NYSEArca,BND),(NYSEArca,VNQ),(NYSEArca,VWO),(NYSEArca, ,DBC),(MUTF,PTTRX),(MUTF,PTTDX),(NYSE,RSP),(NYSE,VBK),(NYSE,IJJ),(NYSE,EFA),(NYSE,RWR),(NYSE,RWO) ,
- Replacing VEA and EFV with PID, PIZ Boosts Morningstar Clone Across the Board
03/01/2011
- Morningstar's 401K Clone Begs the Question- What about Managed Funds?
02/27/2011
- Initiating Tracking of US Subclasses
02/22/2011
- Bernstein's No Brainer and Smart Money Portfolios Reviewed
10/08/2010
- Diversification, Style AND Asset Rotation Improve Portfolio Performance without Incurring Extra Risk
10/08/2010
- Armstrong Index Based Lazy Portfolio Returns Study
09/17/2010
- How Does Your Garden Grow?
09/16/2010
- Schwab ETFs Review
07/27/2010