 |
Vanguard ETF: |  |
7.4%* |
|
Diversified Core: | |
8.1%* |
|
Six Core Asset ETFs: | |
7.3%* |
Articles on VBMFX
- 401K Investments: Alcoa Savings Plan Review
10/11/2011
Retirement investing is a long term process. This report reviews Alcoa Inc Savings Plan MTIA plan, discusses the 401k investment options and presents the plan rating by MyPlanIQ. Asset allocation investment portfolios are examined. Current economic and market conditions are discussed in the context of the investment portfolios in the plan. We will then show how plan participants in Alcoa Inc Savings Plan MTIA can achieve reasonable investment results using portfolio management and risk management strategies for their 401k investments.
Plan Review and Rating
Alcoa, Inc. engages in the production and management of aluminum, fabricated aluminum, and alumina. The company is the largest aluminum provider in the world. Alcoa, Inc. was founded in 1888 and is based in New York, New York.
Alcoa Inc Savings Plan MTIA's 401K plan consists of 13 funds. These funds enable participants to gain exposure to 4 major assets: US Equity, Foreign Equity, Emerging Market Equity, Fixed Income.
Asset Class Ticker Name LARGE GROWTH RAFCX American Funds AMCAP R3 Moderate Allocation RLBFX American Funds American Balanced R5 LARGE BLEND RICFX American Funds Invmt Co of Amer R5 DIVERSIFIED EMERGING MKTS MGEMX Morgan Stanley Inst Emerging Mkts I WORLD STOCK RNPFX American Funds New Perspective R5 Foreign Large Growth PRITX T. Rowe Price International Stock SMALL BLEND PASSX T. Rowe Price Small-Cap Stock Adv Moderate Allocation VGSTX Vanguard STAR Inv LARGE BLEND VITPX Vanguard Instl Ttl Stk Mkt Idx Instl Pls Intermediate-Term Bond VBMFX Vanguard Total Bond Market Index Inv MID-CAP BLEND VIEIX Vanguard Extended Market Idx Instl Small Growth MMCIX BNY Mellon Small/Mid Cap Inv Foreign Large Value MPITX BNY Mellon International M As of Oct 10, 2011, this plan investment choice is rated as average based on MyPlanIQ Plan Rating methodology that measures the effectiveness of a plan's available investment funds. It has the following detailed ratings:
Diversification -- Rated as average (51%)
Fund Quality -- Rated as average (45%)
Portfolio Building -- Rated as above average (81%)
Overall Rating: average (61%)On stock/equity side, it offers various styles (large, mid and small cap) stock funds. Some of those funds are of high quality (such as American Funds AMCAP R3). An excellent moderate allocation fund American Funds American Balanced R5 is available for anyone who prefers using one stop shop fund.
On fixed income (bond) side, Alcoa's plan offers only one Vanguard total bond index fund (VBMFX) for its plan participants. This is an area that can be expanded.
Current Economic and Market Conditions
The U.S. and the rest of the world face long term structural problems that it takes time to correct. The following are some of these problems:
- The consumption driven economies in developed countries and the export driven economies in emerging countries result in a one way trade flow that can only be sustained for a limited time.
- Private households in the U.S. are highly in debt, mostly due to the Federal Reserve's loose monetary policy to prop up consumption and living standards. It is impossible to make debts go away overnight without inflicting severe social and economic hardship.
- Sovereign debt is growing out of control in many countries due to years of relaxed fiscal policies and the recent stimulus driven rescue. It should be noted that this exists not only in developed countries but also in several emerging countries, noticeably in China (adding local government debt, the Chinese government debt would rival the US) and somewhat in Brazil.
- Uneven productivity and competitiveness of work forces in developed countries and emerging countries. Both productivity and competitiveness can be simply measured by return on investment (ROI), or so called 'cost effectiveness'. We can see this uneven productivity from the difference between German workers and those in peripheral European countries as well as the difference between manufacture workers in the U.S. and those in emerging countries.
- The relatively decline of K-12 education quality in the U.S., especially in science and technology, makes it more and more difficult for the country to be competitive in manufacturing and producing high tech goods.
It takes time to correct structural problems as it requires fundamental changes in policies, improvements in productive investments (such as infrastructure upgrade), a better trained current work force and a future generation that is better equipped in science and technology. All this will take time.
In such an environment, it is key to have proper asset allocation in place for one's retirement investment portfolios.
Asset Class Trends
The following table shows how major asset classes such as US equity (stocks), foreign equity, emerging market equity, Real Estate Investment Trusts (REITs), commodities and fixed income (bonds) are ranked based on their price momentum.
Assets Class Symbols 10/10
Trend
Score10/03
Trend
ScoreDirection Gold GLD 7.88% 8.29% v Intermediate Treasuries IEF 3.76% 7.81% v Municipal Bonds MUB 2.29% 3.67% v Total US Bonds BND 2.05% 3.57% v Mortgage Back Bonds MBB 1.45% 2.43% v US Credit Bonds CFT 1.4% 2.41% v International Treasury Bonds BWX 0.87% -1.35% ^ Treasury Bills SHV 0.05% 0.01% ^ Emerging Mkt Bonds PCY -0.27% -0.92% ^ US Stocks VTI -0.74% -10.36% ^ US High Yield Bonds JNK -0.86% -5.7% ^ US Equity REITs VNQ -3.32% -11.9% ^ Commodities DBC -3.68% -8.09% ^ International Developed Stks EFA -4.28% -14.26% ^ International REITs RWX -5.45% -13.89% ^ Emerging Market Stks VWO -10.26% -20.42% ^ Frontier Market Stks FRN -10.66% -19.69% ^ For more information on the trends of major asset classes, please see Asset Class Trend Watch.
Portfolio Discussions
The chart and table below show the historical performance of moderate model portfolios employing strategic and tactical asset allocation strategies. For comparison purpose, we also include the moderate model portfolios of a typical 4 asset SIB (Simpler Is Better) plan . This SIB plan has the following candidate index funds and their ETFs equivalent:
US Equity: SPY or VTI
Foreign Equity: EFA or VEU
Emerging Market Equity: EEM or VWO
Fixed Income: AGG or BND
Performance chart (as of Oct 10, 2011)Performance table (as of Oct 10, 2011)
Portfolio Name 1Yr AR 1Yr Sharpe 3Yr AR 3Yr Sharpe 5Yr AR 5Yr Sharpe Alcoa Inc Savings Plan MTIA Tactical Asset Allocation Moderate -1% -7% 9% 89% 10% 84% Alcoa Inc Savings Plan MTIA Strategic Asset Allocation Moderate -1% -18% 11% 55% 4% 21% Four Core Asset ETF (EM) Benchmark Tactical Asset Allocation Moderate 1% 12% 6% 54% 8% 56% Four Core Asset ETF (EM) Benchmark Strategic Asset Allocation Moderate -4% -40% 10% 37% 3% 6% Currently Fixed Income, Cash and International Bonds are doing well. Only one fixed income bond fund VBMFX is available to Alcoa Inc Savings Plan MTIA participants.
To summarize, participants adopting Alcoa Inc Savings Plan MTIA plan can achieve reasonable investment returns by adopting asset allocation strategies that are tailored to their risk profiles. Diversification and proper risk management are the two major key factors in 401k investing.
Symbols: AA, SPX, COMP, VTI, VEU, VWO, BND, RAFCX, RLBFX, RICFX, MGEMX, RNPFX, PRITX, PASSX, VGSTX, VITPX, VBMFX, VIEIX, MMCIX, MPITX, 401K Investments, Portfolio Management, Retirement Investing
- Keep It Simple Stupid -- A Simple Benchmark to Measure Your Investment Returns
04/19/2011
Living on borrowed time: nuclear reactors, oppressive governments, levees that keep out flood waters -- keeping things going -- just one more year. The temptation to delay until next time is very seductive until disaster strikes and the cost to repair, dwarfs the cost to prevent. Many working people put off their retirement investing -- just one more year until it becomes a "hair on fire" problem -- which it now is for baby boomers for whom retirement is a near and present danger.There is an easy to understand strategy that can improve returns with low risk. If you have a portfolio with the correct asset classes represented, over the long term, you will get better results at a lower risk than picking the latest and greatest fund or stock. This is not the bleeding edge of new ideas. This is proven and widely used – being the basis of most money manager’s strategies.
MyPlanIQ created SIB portfolios (Simpler Is Better) – market index funds from key asset classes that can be used to measure historical returns to show the impact of asset class selection rather than fund or stock selection. SIB portfolios for different numbers of asset classes are built and used to benchmark returns. From this, conclusions can be drawn as to what is an effective investment strategy for today.
The following funds were used:
Index Funds Asset Class
Ticker
Name
Large Blend
Vanguard Total Stock Mkt Idx
Foreign Large Blend
VGTSX
Vanguard Total Intl Stock Index
Diversified Emerging Markets
VEIEX
Vanguard Emerging Mkts Stock Idx
Real Estate
VGSIX
Vanguard REIT Index
Commodities Broad Basket
PowerShares DB Commodity Idx Trking Fund
Intermediate-Term Bond
Vanguard Total Bond Market Index
ETF Asset Classes
Ticker
Description
LARGE BLEND
Vanguard Total Stock Market ETF
Foreign Large Blend
Vanguard FTSE All-World ex-US ETF
Diversified Emerging Markets
Vanguard Emerging Markets Stock ETF
Real Estate
Vanguard REIT Index ETF
Commodities Broad Basket
DBC
PowerShares DB Commodity Idx Trking Fund
Intermediate-Term Bond
Vanguard Total Bond Market ETF
Three Asset Class SIB: The three core assets are U.S. and international equities and fixed income. This represents what used to be conventional wisdom: Heavy dependence on the U.S. and the rest of the developed world. With a conservative strategic asset allocation strategy, the portfolio would consist of 60% fixed income and 20% each for U.S. and international equities. With a tactical asset allocation strategy, the fixed income would never be less than 60% but the split of the three asset classes would move based on asset price movement.
Three Core Asset Portfolios
1 year AR
3 year AR
5 year AR
SAA Index
11%
1%
4%
SAA ETF Index
15%
1%
3%
TAA Index
7%
4%
6%
TAA ETF Index
9%
4%
5%
The SAA (buy and hold) strategy represents what many people may end up with. There is little thought put into which asset classes are represented but these are the most likely ones to be covered.
The TAA strategy gives a little higher long term performance because of the ability to move to other asset classes when one aspect of the economy is slowing.It’s clear that world economics has changed; becoming smaller, more interlinked and complex. It’s no longer possible to ignore the impact of emerging markets and we are very aware that real estate has an impact on the economy.
If you are just using three asset classes, you should look to upgrade your portfolio immediately.
Four Asset Class SIB: There are two variants for the four asset class SIB. Either add emerging markets or real estate trusts to the three asset class SIB. Note that the international asset class means established nations such as those in Europe and emerging asset classes are represented by developing nations. With a conservative strategic asset allocation strategy, the portfolio would consist of 60% fixed income and 13.33% each for U.S., international and REIT or emerging market equities. With a tactical asset allocation strategy, the fixed income would never be less than 60% but the split of the three asset classes would move based on asset price movement.
Four Core Asset Portfolios
1 year AR
3 year AR
5 year AR
SAA Em Index
12%
2%
6%
SAA REIT Index
17%
2%
5%
SAA ETF Em
16%
2%
6%
TAA Emerging
11%
7%
10%
TAA REIT
15%
6%
8%
TAA ETF Em
15%
7%
11%
Adding another asset class improves the performance as it balances risk. TAA is also able to increase its long term benefit over SAA as there are more asset classes to move into when one of the asset classes is not performing properly. Choosing between REIT and emerging markets is hard and further diversification is of long term value.
If you are using a four asset class portfolio, you could be doing better. Making the choice between emerging markets and real estate is a tough one.
Five Asset Class SIB: Has been covered in a previous article and the results are included for completeness. The five class SIB takes both REIT and Emerging markets so is a fusion of the two four asset class SIBs.
Five Core Asset Portfolios
1 year AR
3 year AR
5 year AR
SAA Index
15%
3%
5%
SAA ETF
20%
3%
7%
TAA Index
15%
8%
10%
TAA ETF
19%
8%
12%
The five asset class SIB is a strong platform for portfolio creation. It has broad diversification and, with tactical asset allocation, good returns.
If you are using a five asset class portfolio, you are in good shape – but take a look at the six asset class portfolio because it will be increasingly important in the current macro economic climate.
Six Asset Class SIB: The last asset class adds commodities to the portfolio. This gives another type of asset class and will further help diversification
Adding another asset class does not significantly improve the result within the 5 year time frame. It may be asked whether the extra effort of building and managing a six asset class portfolio is worth it. Broader diversification is good, but is it really necessary? In our view, the addition of commodities will be increasingly important as commodities will protect against inflation as the recovery slowly continues and there is increasing inflationary pressure.
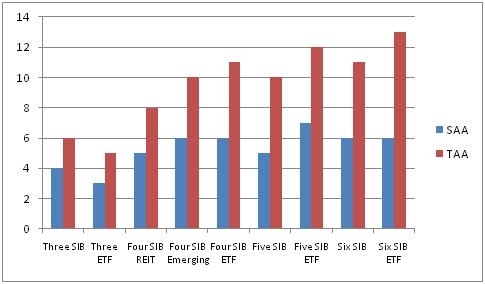
Figure 1 5 Year Annualized Returns for the different SIBs with SAA and TAA strategies
What conclusions can be drawn from this?
-
It’s time to leave a three asset class portfolio in the past. The world is more connected and complex and higher returns require more sophistication
-
Four and five asset class portfolios have fared well and show solid returns but everybody should consider adding commodities in the light of the current economic realities
-
This is not rocket science and you should be able to increase your returns and be in control of improving your returns
-
ETF’s are a very effective vehicle for implementing a SIB strategy and deliver excellent returns compared to the other funds selected
Symbols: AGG, BND, DBC, EEM, EFA, GSG, ICF, IYR, LQD, SPY, TLT, VEU, VNQ, VTI, VWO, VTSMX, VGTSX, VEIEX, VGSIX, VBMFX
Exchange Tickers: (NYSE: AGG), (NYSE: BND), (NYSE: DBC), (NYSE: EEM), (NYSE: EFA), (NYSE: GSG), (NYSE: ICF), (NYSE: IYR), (NYSE: LQD), (NYSE: SPY), (NYSE: TLT), (NYSE: VEU), (NYSE: VNQ), (NYSE: VTI), (NYSE: VWO), (NYSE: VTSMX), (NYSE:VGTSX), (NYSE:VEIEX), (NYSE:VGSIX), (NYSE:VBMFX)
Disclosure:MyPlanIQ does not have any business relationship with the company or companies mentioned in this article. It does not set up their retirement plans. The performance data of portfolios mentioned above are obtained through historical simulation and are hypothetical. -
- Core Satellite – A Way to Step Into Tactical Asset Allocation
10/19/2010
Buy and hold asset allocation has become an almost unquestioned doctrine of long term investing. The emergence of modern portfolio theory in conjunction with a long bull market seemed to prove it largely infallible.
However, recent market events have put the approach under pressure and many are considering buy and hold insufficient without some additional hedges based on what we have seen and learned.
The comparison of returns from strategic and tactical asset allocation over the last five years clearly shows the dilemma. There is a significant benefit to having a tactical component to any portfolio.
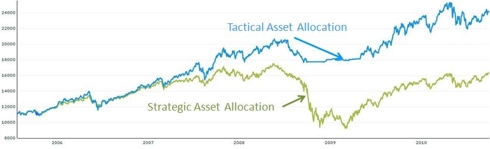
Some may still be suspicious of momentum based investing and while buy and hold has clearly had problems over the past five years there is still reluctance to move. A core satellite strategy where some of the portfolio is tactically managed and the balance is buy and hold may be a good compromise for those wanted to dip their toe into momentum based portfolios.
We have used SIB portfolios to demonstrate the benefit of asset allocation. SIB’s are made up of the market index funds so that there is no special sauce in the fund selection. We are going to extend the use of SIBs to create core satellite portfolios and compare their performance properties against a pure strategic and pure tactical asset allocation of the same fund base.
The portfolios will have six asset classes as they have an optimal level of performance traded off against the effort to maintain a large number of asset classes.
Index Funds Asset ClassTickerNameLarge BlendVTSMXVanguard Total Stock Mkt IdxForeign Large BlendVGTSXVanguard Total Intl Stock IndexDiversified Emerging MarketsVEIEXVanguard Emerging Mkts Stock IdxReal EstateVGSIXVanguard REIT IndexCommodities Broad BasketDBCPowerShares DB Commodity Idx Trking FundIntermediate-Term BondVBMFXVanguard Total Bond Market IndexETF Asset ClassesTickerLARGE BLENDVTI, SPYForeign Large BlendVEU, EFADiversified Emerging MarketsVWO, EEMReal EstateVNQ, IYRCommodities Broad BasketDBCIntermediate-Term BondBND, AGG
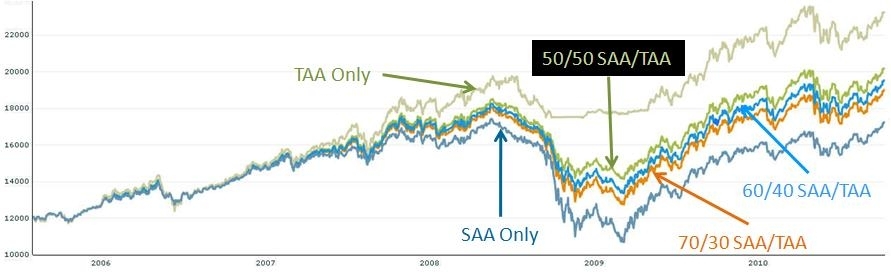
We are going to compare five portfolios:- Tactical Asset Allocation only with 40% in fixed income
- Strategic Asset Allocation only with 40% in fixed income
- 50/50 Strategic/Tactical 40%
- 60/40 Strategic/Tactical 40%
- 70/30 Strategic/Tactical 40%
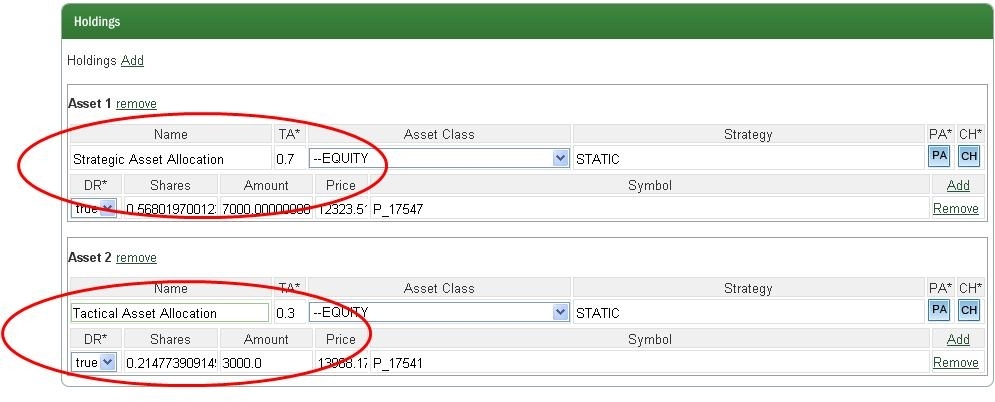
Building and maintaining a core-satellite portfolio can be labor intensive and error prone or expensive to outsource. The MyPlanIQ system enables an individual to rapidly build and maintain a model core-satellite portfolio and be able create historical results. This is how the comparison was achieved in this case.
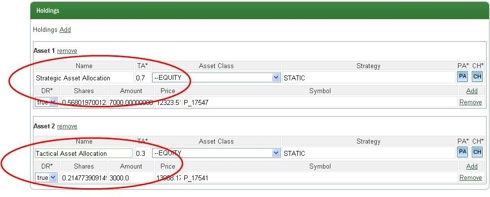
The screenshot shows how to assign a percentage of the portfolio to strategic and tactical asset allocation and then examine the performance of the portfolio. In this case, it is 70% strategic and 30% tactical asset allocation
Intuitively we would expect to see tactical asset allocation giving us the highest returns with, perhaps a little more volatility and the hybrid portfolios giving a range of returns and volatility.
Portfolio Performance ComparisonPortfolio Name1Yr AR3Yr AR5Yr AR10%9%14%11%6%11%11%5%10%12%4%10%13%2%7%
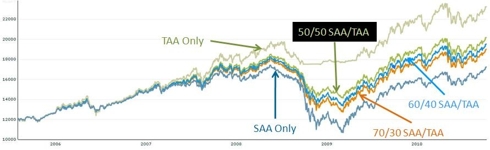
The results are much as expected with tactical asset allocation and strategic asset allocation bounding performance ranges and the core satellites filling in the middle.
The draw down ratios also behave as expected.
Portfolio/DD1 Yr3 Yr5 YrInceptionTAA10%12%14%14%50-50%9%24%24%24%60-409%27%27%27%70-308%29%29%29%SAA8%39%39%39%
The concept of a core-satellite portfolio may appeal to many. The problem of constructing an measuring such a portfolio has been greatly simplified with analytical tools such as the MyPlanIQ system.
Takeaways- In the current market conditions, tactical asset allocation still provides the best performance and has the lowest risk
- Those who want to move cautiously into momentum based portfolios can use core-satellite to dip their toe into the water
- ETF’s are an ideal, low cost vehicle to construct a core satellite portfolio
labels:investment,
Symbols:DBC,VBMFX,VTI,SPY,VEU,EFA,VWO,EEM,VNQ,IYR,BND,AGG,Portfolio-Building,with,ETFs,Closed-End,Funds,Commodity,ETFs,Developed,Market,ETFs,core-satellite,
- Understanding and Building Your ETF Portfolio
06/27/2010
There is an easy to understand strategy that can lead to high returns with low risk. If you have a portfolio with the correct asset classes represented, over the long term, you will get better results at a lower risk than picking the latest and greatest fund or stock. This is not the bleeding edge of new ideas. This is proven and widely used – being the basis of most money manager’s strategies.
MyPlanIQ created SIB portfolios (Simpler Is Better) – market index funds from key asset classes that can be used to measure historical returns to show the impact of asset class selection rather than fund or stock selection. SIB portfolios for different numbers of asset classes are built and used to benchmark returns. From this, conclusions can be drawn as to what is an effective investment strategy for today.
The following funds were used:
Index Funds Asset Class
Ticker
Name
Large Blend
VTSMX
Vanguard Total Stock Mkt Idx
Foreign Large Blend
VGTSX
Vanguard Total Intl Stock Index
Diversified Emerging Markets
VEIEX
Vanguard Emerging Mkts Stock Idx
Real Estate
VGSIX
Vanguard REIT Index
Commodities Broad Basket
DBC
PowerShares DB Commodity Idx Trking Fund
Intermediate-Term Bond
VBMFX
Vanguard Total Bond Market Index
ETF Asset Classes
Ticker
Description
LARGE BLEND
VTI
Vanguard Total Stock Market ETF
Foreign Large Blend
VEU
Vanguard FTSE All-World ex-US ETF
Diversified Emerging Markets
VWO
Vanguard Emerging Markets Stock ETF
Real Estate
VNQ
Vanguard REIT Index ETF
Commodities Broad Basket
DBC
PowerShares DB Commodity Idx Trking Fund
Intermediate-Term Bond
BND
Vanguard Total Bond Market ETF
Three Asset Class SIB: The three core assets are US and international equities and fixed income. This represents what used to be conventional wisdom: Heavy dependence on the US and the rest of the developed world. With a conservative strategic asset allocation strategy, the portfolio would consist of 60% fixed income and 20% each for US and international equities. With a tactical asset allocation strategy, the fixed income would never be less than 60% but the split of the three asset classes would move based on asset price movement.
Three Core Asset Portfolios
1 year AR
3 year AR
5 year AR
SAA Index
11%
1%
4%
SAA ETF Index
15%
1%
3%
TAA Index
7%
4%
6%
TAA ETF Index
9%
4%
5%
The SAA (buy and hold) strategy represents what many people may end up with as there is little thought put into which asset classes are represented but these are the most likely ones to be covered. The TAA strategy gives a little higher long term performance because of the ability to move to other asset classes when one aspect of the economy is slowing.
It’s clear that world economics has changed becoming smaller, more interlinked and complex. It’s no longer possible to ignore the impact of emerging markets and we are very aware that real estate has an impact on the economy.
If you are just using three asset classes, you should look to upgrade your portfolio immediately.
Four Asset Class SIB: There are two variants for the four asset class SIB. Either add emerging markets or real estate trusts to the three asset class SIB. Note that the international asset class means established nations such as those in Europe and emerging asset classes are represented by developing nations. With a conservative strategic asset allocation strategy, the portfolio would consist of 60% fixed income and 13.33% each for US, international and REIT or emerging market equities. With a tactical asset allocation strategy, the fixed income would never be less than 60% but the split of the three asset classes would move based on asset price movement.
Four Core Asset Portfolios
1 year AR
3 year AR
5 year AR
SAA Em Index
12%
2%
6%
SAA REIT Index
17%
2%
5%
SAA ETF Em
16%
2%
6%
TAA Emerging
11%
7%
10%
TAA REIT
15%
6%
8%
TAA ETF Em
15%
7%
11%
Adding another asset class improves the performance as it balances risk. TAA is also able to increase its long term benefit over SAA as there are more asset classes to move into when one of the asset classes is not performing properly. Choosing between REIT and emerging markets is hard and further diversification is of long term value.
If you are using a four asset class portfolio, you could be doing better and making the choice between emerging markets and real estate is a tough one.
Five Asset Class SIB: Has been covered in a previous article and the results are included for completeness. The five class SIB takes both REIT and Emerging markets so is a fusion of the two four asset class SIBs.
Five Core Asset Portfolios
1 year AR
3 year AR
5 year AR
SAA Index
15%
3%
5%
SAA ETF
20%
3%
7%
TAA Index
15%
8%
10%
TAA ETF
19%
8%
12%
The five asset class SIB is a strong platform for portfolio creation. It has broad diversification and, with tactical asset allocation, good returns.
If you are using a five asset class portfolio, you are in good shape – but take a look at the six asset class portfolio because it will be increasingly important in the current macro economic climate.
Six Asset Class SIB: The last asset class adds commodities to the portfolio. This gives another type of asset class and will further help diversification
Adding another asset class does not significantly improve the result within the 5 year timeframe. It may be asked whether the extra effort of building and managing a six asset class portfolio is worth it. Broader diversification is good, but is it really necessary? In our view, the addition of commodities will be increasingly important as commodities will protect against inflation as the recovery slowly continues and there is increasing inflationary pressure.
Figure 1 5 Year Annualized Returns for the different SIBs with SAA and TAA strategies
What conclusions can be drawn from this?
· It’s time to leave a three asset class portfolio in the past. The world is more connected and complex and higher returns require more sophistication
· Four and five asset class portfolios have fared well and show solid returns but everybody should consider adding commodities in the light of the current economic realities
· This is not rocket science and you should be able to increase your returns and be in control of improving your returns
· ETF’s are a very effective vehicle for implementing a SIB strategy and deliver excellent returns compared to the other funds selected
In a future article, we will look at the impact of the actual fund selection to increase the return still further.
labels:investment,ETFs,401K,IRA,
Symbols:vti,spy,veu,efa,vwo,eem,iyr,icf,vnq,dbc,gsg,bnd,agg,tlt,lqd,VTSMX,VGTSX,VEIEX,VGSIX,VBMFX,

- Apple 401K Report On 06/01/2011
06/01/2011
This article is part of a series of case studies we are conducting for various 401K plans. In this article, we will discuss how participants in Apple 401K can achieve reasonable investment results using asset allocation strategies. We will also discuss how those portfolios are positioned in today’s market environment.
Apple Inc., (Ticker: AAPL) together with subsidiaries, designs, manufactures, and markets personal computers, mobile communication devices, and portable digital music and video players, as well as sells various related software, services, peripherals, and networking solutions. The company sells its products worldwide through its online stores, retail stores, direct sales force, third-party wholesalers, resellers, and value-added resellers. In addition, it sells various third-party Macintosh, iPhone, and iPod compatible products, including application software, printers, storage devices, speakers, headphones, and various other accessories and peripherals through its online and retail stores, and digital content and applications through the iTunes Store. The company sells its products to consumer, small and mid-sized business, education, enterprise, government, and creative customers. As of September 26, 2009, it had 273 retail stores, including 217 stores in the United States and 56 stores internationally. The company, formerly known as Apple Computer, Inc., was founded in 1976 and is headquartered in Cupertino, California.
Apple offers generous benefits to its employees. It was the first high tech company in Bay Area that offered free day care for employees' children.
Apple 401K's 401K plan consists of 14 funds. These funds enable participants to gain exposure to 4 major assets: US Equity, Foreign Equity, REITs, Fixed Income. Four Core Asset Index Funds REITs's 401K plan consists of funds. These funds enable participants to gain exposure to 4 major assets: US Equity, Foreign Equity, REITs, Fixed Income.
The list of minor asset classes covered by Apple 401K The list of minor asset classes covered by Four Core Asset Index Funds REITs Asset Class Apple 401K Four Core Asset Index Funds REITs Total 14
As of May 27, 2011, Apple 401K investment choice is rated as average and Four Core Asset Index Funds REITs investment choice is rated as based on MyPlanIQ Plan Rating methodology that was designed to measure how effective a plan's available investment funds are . It has the following detailed ratings:
Attribute Apple 401K Four Core Asset Index Funds REITs Diversification above average (85%) Fund Quality below average (15%) No Rating Portfolio Building average (59%) No Rating Overall Rating average (54%) No Rating
The chart and table below show the historical performance of moderate model portfolios employing strategic and tactical asset allocation strategies (SAA and TAA , both provided by MyPlanIQ). For comparison purpose, we also include the moderate model portfolios of a typical 4 asset SIB (Simpler Is Better) plan . This SIB plan has the following candidate index funds and their ETFs equivalent:
US Equity: SPY or VTI
Foreign Equity: EFA or VEU
REITs: IYR or VNQ or ICF
Fixed Income: AGG or BND
Performance chart (as of May 27, 2011)Performance table (as of May 27, 2011)
Portfolio Name 1Yr AR 1Yr Sharpe 3Yr AR 3Yr Sharpe 5Yr AR 5Yr Sharpe Apple 401K Tactical Asset Allocation Moderate 12% 159% 9% 122% 9% 99% Apple 401K Strategic Asset Allocation Moderate 14% 225% 4% 27% 5% 32% Four Core Asset Index Funds REITs Tactical Asset Allocation Moderate 10% 88% 8% 81% 10% 85% Four Core Asset Index Funds REITs Strategic Asset Allocation Moderate 17% 158% 4% 19% 6% 24% Currently are doing well. But these asset classes are not available to Apple 401K participants.
To summarize, Apple 401K plan participants can achieve reasonable investment returns by adopting asset allocation strategies that are tailored to their risk profiles. Currently, the tactical asset allocation strategy indicates overweighing on Foreign Equity, REITs and Fixed Income funds.
Disclosure:MyPlanIQ does not have any business relationship with the company or companies mentioned in this article. It does not set up their retirement plans. The performance data of portfolios mentioned above are obtained through historical simulation and are hypothetical.
Symbols:AAPL, CASH, VBMFX, LHYZX, FBAKX, FGRIX, FMGKX, VITPX, VITSX, NAESX, FCNTX, RGRYX, VGTSX, VDMIX, TAREX, VTSMX, VGSIX
Exchange Tickers: (AAPL), (CASH), (VBMFX), (LHYZX), (FBAKX), (FGRIX), (FMGKX), (VITPX), (VITSX), (NAESX), (FCNTX), (RGRYX), (VGTSX), (VDMIX), (TAREX), (VTSMX), (VGSIX) - Ford Motor 401K Report On 06/01/2011
06/01/2011