 |
Vanguard ETF: |  |
7.4%* |
|
Diversified Core: | |
8.1%* |
|
Six Core Asset ETFs: | |
7.3%* |
Articles on RWX
- Retirement Income ETFs vs. Income Mutual Funds: An Update
09/11/2011
We first compared asset allocation portfolios using dividend ETFs (and bond ETFs) and those using income mutual funds on SeekingAlpha.com Retirement Income Investing: ETFs vs. Mutual Funds more than two months ago. Let's review these two plans: Retirement Income ETFs and Schwab Income Mutual Fund Select List.
Here are the asset classes covered by the two plans:
The list of minor asset classes covered by Retirement Income ETFs The list of minor asset classes covered by Schwab Income Mutual Fund Select List Diversified Emerging Mkts: EEM, VWO, DEM
Emerging Markets Bond: EMB, PCY
Equity Energy: AMJ
Foreign Large Value: PID, IDV
Global Real Estate: RWX
High Yield Bond: HYG
Inflation-protected Bond: TIP
Intermediate Government: IEI
Intermediate-term Bond: CIU, CORP, MBB
Large Blend: VIG
Large Value: DVY, SDY, VYM, FVD
Long Government: IEF, TLT
Long-term Bond: LQD, VCLT
Mid-cap Value: PEY
Miscellaneous Sector: PFF
Muni National Long: MUB
Muni Short: SHM
Real Estate: IYR, ICF, VNQ
Short Government: SHY
Short-term Bond: CSJ, VCSH
World Bond: BWX, WIPEmerging Markets Bond: TGINX
Foreign Large Blend: SICNX, LISOX
Foreign Large Value: AAIPX
High Yield Bond: STHTX, MWHYX
Inflation-protected Bond: ACITX
Intermediate Government: SWGSX, CPTNX
Intermediate-term Bond: SWIIX, SAMFX, PTTDX, PGBOX, MWTRX, FTRFX
Large Blend: SWANX, TICRX, PRBLX
Large Growth: SWLSX, JENSX
Large Value: TWEIX, PQIAX
Mid-cap Blend: NMMCX
Mid-cap Value: ARDEX
Multisector Bond: PONDX
Muni National Interm: SWNTX, TWTIX, STTBX
Muni National Long: NOTEX, ACLVX
Muni Short: FSHIX
Real Estate: CSRSX
Short Government: FIGTX
Short-term Bond: FSTIX, ACSNX
Ultrashort Bond: SIGVX
World Bond: PFODXAsset Class Retirement Income ETFs Schwab Income Mutual Fund Select List REITs 4 1 Fixed Income 19 24 Sector Fund 2 0 Foreign Equity 2 3 Emerging Market Equity 3 0 US Equity 6 9 Other 0 0 Total 36 37 Little in the two plans' investment choice ratings has changed since then. As of Sep 9, 2011, Retirement Income ETFs investment choice is rated as average and Schwab Income Mutual Fund Select List investment choice is rated as above average based on MyPlanIQ Plan Rating methodology that was designed to measure how effective a plan's available investment funds are . It has the following detailed ratings:
Attribute Retirement Income ETFs Schwab Income Mutual Fund Select List Diversification great (95%) great (85%) Fund Quality below average (29%) great (85%) Portfolio Building above average (67%) above average (71%) Overall Rating average (64%) above average (80%)
Performance chart (as of Sep 9, 2011)Performance table (as of Sep 9, 2011)
Portfolio Name 2011 YTD 1Yr AR 1Yr Sharpe 3Yr AR 3Yr Sharpe 5Yr AR 5Yr Sharpe Retirement Income ETFs Tactical Asset Allocation Moderate 2.49% 8% 80% 11% 84% 10% 71% Retirement Income ETFs Strategic Asset Allocation Moderate -1.16% 5% 42% 5% 23% 3% 14% Schwab Income Mutual Fund Select List Tactical Asset Allocation Moderate 3% 9% 84% 11% 101% 10% 92% Schwab Income Mutual Fund Select List Strategic Asset Allocation Moderate -2.11% 4% 35% 4% 27% 3% 16% Refer to detailed portfolio comparison.
Again, we are seeing income ETFs can still rival the well selected income mutual funds. This is a good news for income investors in their IRA investments or taxable account investments. ETFs have more flexibility and have a well defined and simple indexing strategy (isn't this what MyPlanIQ is also doing?).
Disclosure:MyPlanIQ does not have any business relationship with the company or companies mentioned in this article. It does not set up their retirement plans. The performance data of portfolios mentioned above are obtained through historical simulation and are hypothetical.
Symbols: SPX, VIG, DVY, SDY, ICF, RWX, HYG, LQD, IEF, TLT, TIP, AMJ, TWEIX, LISOX, CSRSX, PTTDX, Retirement Investments, IRAs, ETF Portfolios, Portfolio Management, Risk Management, Dividend ETFs
- Foreign Large Cap Equities Deliver Strong Returns Among Dividend Stock ETFs
05/04/2011
Foreign Large Cap Equity ETFs allow investors to diversify their portfolios by gaining exposure large stocks in developed economies across the globe. These ETFs track equities from nations like Japan, the UK, and Germany, among many others. These ETFs invest primarily in stocks with market caps in the top 70% of their respective markets.
Among Dividend Stock ETFs (see table), those that track Foreign Large Cap Equities performed very well in the past week, continuing their string performance over the past 52 weeks.. The iShares Dow Jones International Select Dividend ETF (IDV) returned 2.81% in the past week and over 28% in the past 52 weeks. Also performing well among Dividend Stock ETFs was the iShares MSCI EAFE Index ETF (EFA), which gained 2.69% in the last week and almost 18% during the past year.
Top Dividend Stock ETF Trends
4/29/2011
ETF Name Symbol 1 Week 4 Weeks SPDR DJ Wilshire Intl Real Estate RWX 2.98% 5.22% iShares Dow Jones Intl Select Div Idx IDV 2.81% 6.02% iShares MSCI EAFE Index EFA 2.69% 4.90% iShares Dow Jones US Real Estate IYR 2.62% 4.78% First Trust Value Line Dividend Index FVD 1.93% 3.15% SPDR S&P 500 SPY 1.93% 2.18% iShares Dow Jones Select Dividend Index DVY 1.89% 2.32% Vanguard High Dividend Yield Indx VYM 1.84% 3.27% PowerShares Intl Dividend Achievers PID 1.81% 4.28% PowerShares HighYield Dividend Achievers PEY 1.73% 1.78% The growth of these ETFs has followed an upward trend in the overall equity market in recent periods. As a higher percentage of the world's equity market capitalization continues to shift away from the United States, Foreign Large Cap Equities will continue to bring strong returns to investors.
Foreign Large Cap Equities
04/29/2011Description Symbol 1 Yr 3 Yr 5 Yr Avg. Volume(K) 1 Yr Sharpe iShares MSCI EAFE Index EFA 16.26% -3.93% 0.58% 17,665 68.32% Vanguard MSCI EAFE ETF VEA 21.49% -0.87% NA 2,135 88.16% Schwab International Equity SCHF 19.65% NA NA 180 86.62% iShares Dow Jones Intl Select IDV 26.81% 1.73% NA 156 107.04% iShares MSCI EAFE Value Index EFV 14.36% -4.8% -1.08% 133 55.66% PowerShares Intl Dividend Achievers PID 20.98% -1.56% 2.87% 121 112.83% iShares MSCI EAFE Growth Index EFG 19.53% -2.71% 1.55% 84 86.67% PowerShares DWA Dev Mkts Techn PIZ 22.65% -0.49% NA 115 93.38% In addition to the ETFs mentioned above, others in the Foreign Large Cap sector have shown strong growth in recent periods. The PowerShares DWA Developed Markets Technical ETF has returned 22.65% in the past year and the Vanguard MSCI EAFE ETF (VEA) gained 21.49% during the same period. These strong gains have helped to offset the large valuation declines experience during the recent financial crisis.
While high equity valuations may trigger a market retraction in coming periods, Foreign Large Cap Equity ETFs should remain a substantial part of any well-diversified portfolio.
Symbols: EFA, VEA, SCHF, IDV, EFV, PID, EFG, PIZ, RWX, IDV, EFA, IYR, FVD, SPY, DVY, VYM, PEY
Disclosure: MyPlanIQ does not have any business relationship with the company or companies mentioned in this article. It does not set up their retirement plans. The performance data of portfolios mentioned above are obtained through historical simulation and are hypothetical.
- International REIT Rapidly Becoming A Key Area For Investors
04/21/2011
Global REIT (Real Estate Investment Trust) markets showed major growth in 2007 capturing $900 billion of equities capitalization according to the stats of National Association of Real Estate Investment Trusts (NARIET). Previously U.S and Australia were the major market but today REITs are adopted by many foreign countries. In fact a REIT portfolio should have a strong international flavor and as this gives you better diversification offering better risk adjusted returns.
These are the major country international REITS
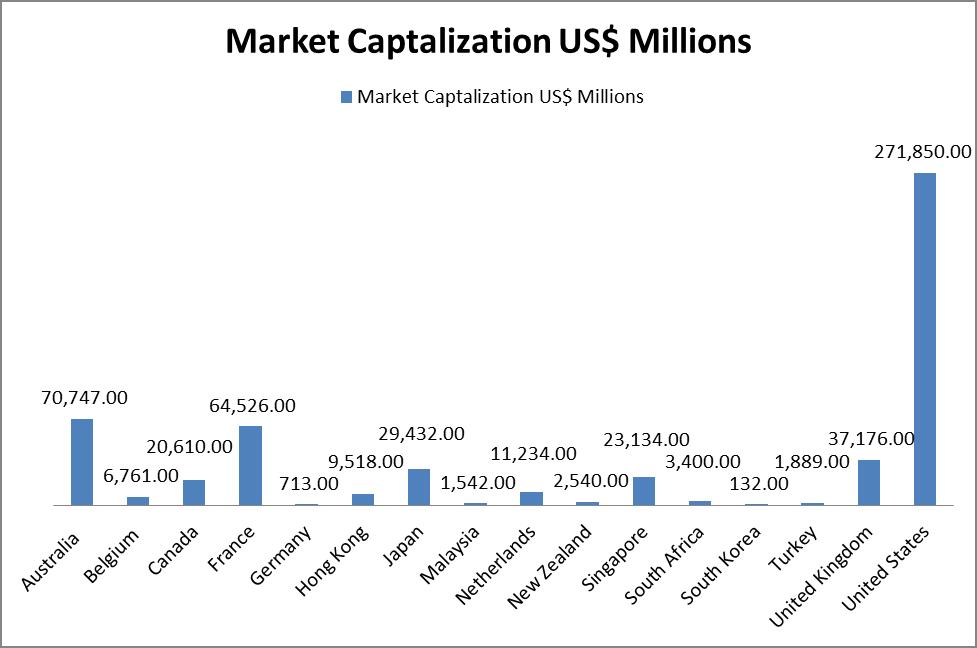
(Source: Ernst & young – Global Real investment trust report 2010)
In the recent recession where investors dumped their equity positions and unemployment accelerated, international REITS did not have such a sever shock. Even with the global economic crisis in the past years, we have only seen a few REIT bankruptcies. Recent development in Japan and U.S show the true growth prospect of REIT. Banks have worked with REITs to modify or extend maturities on existing loans rather than force sales in a demanding market.
We show a table of the leading international REIT ETF’s.
Description
Symbol
1 Yr
3 Yr
5 Yr
Avg. Volume(K)
1 Yr Sharpe
SPDR Dow Jones Intl Real Estat
20.47%
-5.23%
NA
385
88.47%
SPDR Dow Jones Global Real Estate
19.99%
NA
NA
76
104.5%
WisdomTree International Real Estate
18.39%
-5.85%
NA
32
82.37%
iShares S&P Dev ex-US Property
11.25%
-5.94%
NA
25
52.74%
iShares FTSE EPRA/NAREIT Dev Real Estate
8.59%
-7.37%
NA
91
42.21%
Most of the REITS have similar results except IFGL and WPS. RWX is the best with a one year yield of 20.47%, best of the three year returns (although not good) and the highest volume. RWX volumes are also very good but all these ETF are new and none them has 5 year yields.
Ernst and young research stats clearly shows the International REITS diversification
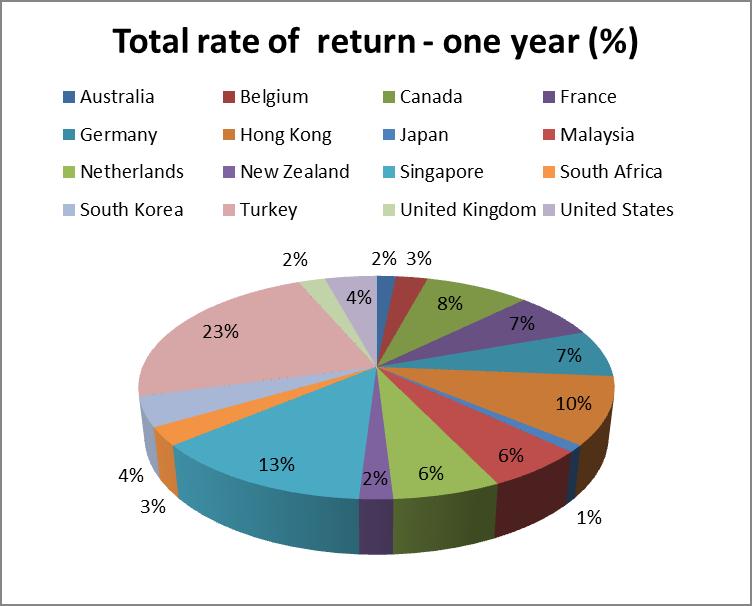
(Source: Ernst & young – Global Real investment trust report 2010)
Government also help REITs – for example, U.S REITs are given special tax status to avoid corporate taxes, the corporates will be exempt from taxes if they distribute their 90% of income by way of dividend to investors.
In the UK, the government encourages REITs to own residential property. In Germany government are rescinding their rules of prohibiting REITs from investing in residential property not only this they also provide an incentive of 50% exemption on capital gains tax for institutional and corporate property owners that sell assets to REITs.
In Japan the government also provides a facility for J-REITs to purchase or re?nance bonds coming due and has thereby shored up investor con?dence.
International REITs provides diversity in the real estate sector. By diversifying the portfolio with international REITs we can not only hedge the risk but we can increase our returns too. REITS are a necessary element of a portfolio. Without REITs ETF we lose a major growth opportunity as increasing world population and the demand for property. With the appropriate diversification from International REIT we can increase the potential for better risk adjusted returns.
Symbols: RWX, RWO, DRW, WPS, IFGL
Tickers: (NYSE: RWX), (NYSE: RWO), (NYSE: DRW), (NYSE: WPS), (NYSE: IFGL)
Disclosure:
MyPlanIQ does not have any business relationship with the company or companies mentioned in this article. It does not set up their retirement plans. The performance data of portfolios mentioned above are obtained through historical simulation and are hypothetical - Armstrong's Informed Investor Lazy Portfolio Feels The Commodities Pain
04/18/2011
The incidents in Japan, the Middle East and even as far back as New Orleans teach us the danger of living on borrowed time, the reactors, the governments the levees keeping things going -- just one more year. The temptation to delay until next time is very seductive until disaster strikes and the cost to repair, dwarfs the cost to prevent. Many working people put off their retirement investing -- just one more year until it becomes a "hair on fire" problem -- which it now is for baby boomers for whom retirement is a near and present danger.
We continue to examine luminary portfolios to see what we can learn and use to further our investment portfolios.
Frank Armstrong, author of The Informed Investor, proposed this portfolio for an MSN Money article. The two key points of the portfolio are that it has four asset classes (US, International, REIT, Bonds) and relies on market indices rather than active management. The portfolio uses index funds because index funds eliminate manager risk. It overweights small-cap stocks as small-cap stocks have historically outperformed large caps stocks. The portfolio has a strong value tilt, based on the theory that, over the long haul, beaten-down stocks will perform better than high-flying growth stocks.
This should be a low cost, well performing portfolio.
The fund selection for testing the strategy is listed below with the ETF alternatives:
- 9.25% in Vanguard Small Cap Value VISVX (SCZ)
- 9.25% in Vanguard Value VIVAX (SPY, IYY)
- 6.25% in Vanguard Small-Cap Growth VISGX (VBK)
- 6.25% in Vanguard 500 Index VFINX (IVW)
- 31% in Vanguard Total International Stock VGTSX (EFA)
- 8% in Vanguard REIT VGSIX (IYR, VNQ, RWX)
- 30% in Vanguard Short-Term Bond VBISX (BND, AGG)
Things to note about the portfolio:
- This is designed as a lazy portfolio with limited rebalancing specified
- 31% in US equities is significant with a mix of large and small cap stocks
- With 70% in equities, this is a growth portfolio
- REIT is possibly underweighted
- There is no commodity asset class
The chart and table below show the historical performance of moderate model portfolios employing strategic and tactical asset allocation strategies. For comparison purpose, we also include the moderate model portfolios of a typical 6 asset SIB (Simpler Is Better) plan . This SIB plan has the following candidate index funds and their ETFs equivalent: US Equity: SPY or VTI
Commodity: DBC
Foreign Equity: EFA or VEU
REITs: IYR or VNQ or ICF
Emerging Market Equity: EEM or VWO
Fixed Income: AGG or BND
Portfolio Performance Comparison
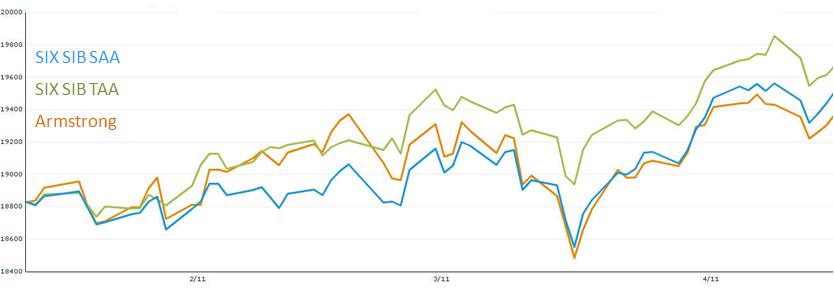
Portfolio/Fund Name 1Yr AR 1Yr Sharpe 3Yr AR 3Yr Sharpe 5Yr AR 5Yr Sharpe Armstrong Original 10% 66% 4% 17% 5% 20% Six Core Asset ETF Benchmark Tactical Asset Allocation Moderate 10% 71% 9% 73% 13% 91% Six Core Asset ETF Benchmark Strategic Asset Allocation Moderate 13% 103% 3% 20% 7% 35% A detailed comparison can be found here
Takeaways
-
2010 was a good year for lazy portfolios and as we continue through 2011while equities are still performing well, not having a commodities option hurts returns
-
TAA has benefits in terms of being able to stay away from some area such as European equities
-
Index funds continue to show good results against managed funds
-
Larger asset class plans have the benefit of stability and good returns
Disclosure: MyPlanIQ does not have any business relationship with the company or companies mentioned in this article. It does not set up their retirement plans. The performance data of portfolios mentioned above are obtained through historical simulation and are hypothetical.
Symbols: VISVX, SCZ, VIVAX, SPY, IYY, VISGX, VBK, VFINX, IVW, VGTSX, EFA, VGSIX, IYR, VNQ, RWX, BND, AGG, DBC, VEU, ICF, EEM, VWO - Bernstein No Brainer and Smart Money Lazy Portfolios Under The Microscope
04/15/2011
Retirement investing is now a "hair on fire" problem for Boomers who have no time to waste in getting their portfolios in order. The challenge is how to avoid being overwhelmed with conflicting data and shutting down.
We present simple approaches to understand the path to higher returns with lower risk.
Dr. William Bernstein is the author of the "Intelligent Asset Allocator" and "The Four Pillars of Investing." He's also a physician, neurologist and financial adviser to high-net-worth individuals. He has proposed a number of lazy portfolios. There are two that we now examine in the light of a more active benchmark which has monthly instead of annual rebalancing.
The no-brainer portfolio comprises the following fund allocation:
-
25% in Vanguard 500 Index VFINX (IVW)
-
25% in Vanguard Small Cap NAESX or VTMSX (VB)
-
25% in Vanguard Total International VGTSX or VTMGX (EFA, VEA)
-
25% in Vanguard Total Bond VBMFX or VBISX (BND)
Things to note about the portfolio:
-
Heavily weighted towards domestic equities
-
Similar to a three asset SIB [simpler-is-better] with domestic, international and fixed income
-
It would be better to have some REIT or emerging markets exposure
The smart money portfolio comprises the following fund allocation:-
40% Vanguard Short Term Investment Grade VFSTX (SCJ, SHY)
-
15% Vanguard Total Stock Market VTSMX (VTI)
-
10% Vanguard Small Cap Value VISVX (VBR)
-
10% Vanguard Value Index VIVAX (VTV)
-
5% Vanguard Emerging Markets Stock VEIEX (VWO)
-
5% Vanguard European Stock VEURX (VEU)
-
5% Vanguard Pacific Stock VPACX (VPL)
-
5% Vanguard Small Cap Value NAESX or VTMSX (VB)
To summarize:
-
40% in U.S. equities
-
10% in international equities
-
5% in emerging market equities
-
5% in REITs
-
40% in fixed income
The smart money portfolio is more conservative and has two more asset classes but they only represent five percent of the portfolio each. With 80% of the portfolio in US and fixed income, it isn't very different from the no brainer portfolio.
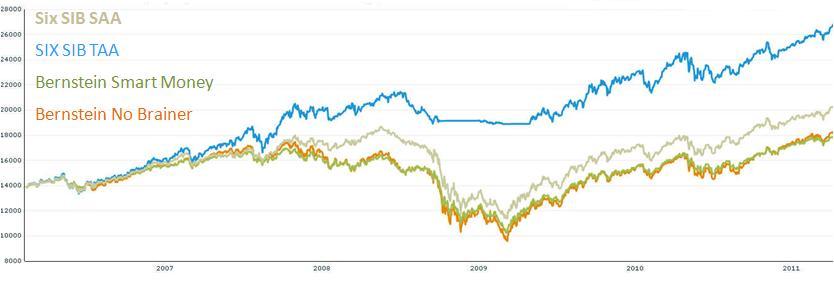
We are going to use the SIB (Simpler Is Better) Portfolio as a benchmark. The SIB comprise – market index funds (ETFs or Mutual Funds) from key asset classes that can be used to measure historical returns to show the impact of asset class selection rather than fund or stock selection. We are going to use a six asset ETF SIBs. This will enable us to see the type of returns we can expect and contrast Mutual Funds and ETFsThe following funds are used:
Asset Class Ticker Name LARGE BLEND VTI Vanguard Total Stock Market ETF Foreign Large Blend VEU Vanguard FTSE All-World ex-US ETF DIVERSIFIED EMERGING MKTS VWO Vanguard Emerging Markets Stock ETF REAL ESTATE VNQ Vanguard REIT Index ETF COMMODITIES BROAD BASKET DBC PowerShares DB Commodity Idx Trking Fund Intermediate-Term Bond BND Vanguard Total Bond Market ETF The strategic asset allocation strategy has 40% in fixed income and 12% in the other five funds.
The tactical asset allocation strategy has 40% in fixed income and 30% in the top two asset class funds determined by the price momentum -- unless that performance is below fixed income when the money will be diverted to fixed income. If fixed income is performing below cash, the fixed income portion will be cash.Portfolio Analysis
Portfolio Performance Comparison
Portfolio/Fund Name 1Yr AR 1Yr Sharpe 3Yr AR 3Yr Sharpe 5Yr AR 5Yr Sharpe P William Bernstein No Brainer Nine Fund Portfolio Annual Rebalance 8% 79% 4% 20% 4% 21% P William Bernstein No Brainer Four Fund Portfolio 11% 87% 4% 18% 5% 19% Six Core Asset ETF Benchmark Tactical Asset Allocation Moderate 10% 71% 9% 73% 13% 91% Six Core Asset ETF Benchmark Strategic Asset Allocation Moderate 13% 103% 4% 20% 7% 35% Takeaways
- Both Bernstein portfolios perform satisfactorily for a lazy portfolio – it is surprising that the no-brainer performs so well against its more diversified smart-money cousin
- The Six Asset SIB buy and hold outperforms both Bernstein portfolios based on broader diversification.
- Tactical Asset Allocation reduces downside risk and that wins in the current uncertain environment
Symbols: BND, DBC, EFA, IVW, NAESX, RWX, SCJ, SHY, VB, VBR, VEA, VEIEX, VEU, VEURX, VFINX, VFSTX, VGSIX, VISVX, VIVAX, VNQ, VPACX, VPL, VTI, VTMGX, VTMSX, VTSMX, VTV, VWO
Disclosure:
MyPlanIQ does not have any business relationship with the company or companies mentioned in this article. It does not set up their retirement plans. The performance data of portfolios mentioned
-
- Schwab Mutual Funds Beat out ETFs
04/06/2011
- Tactically Manage An Income Producing Portfolio With Commodity Exposure
03/25/2011
- Japan’s Disasters Slams the Market – What Happens to REIT Now?
03/22/2011
- Earthquakes and Wars Call for Diversification and Tactical Asset Allocation in Investing
03/20/2011
- 'Safe' Assets' Trends Back to Positive: Risk Aversion Began?
03/14/2011
- Major Assets: Risk Assets Strong While Safe Assets Have Negative Trends
03/07/2011
- Commodities Showed Their Hedge Amid Equity Weakness
02/28/2011
- Dividend Stock ETFs All Dropped, But Showing Defensive
02/24/2011
- Major Asset Trends: U.S. Stocks and REITs Strong, International Bonds Worth Considering
02/22/2011
- E-Trade ETF Plan Hits Most of the High Notes
02/16/2011
- Major Asset Trends: Divergence of U.S. Stocks and Emerging Market Stocks Continues
02/14/2011
- Risk Chase Slows Down: A Good Time to Review Your Portfolios
01/10/2011
- Risk Appetite in Major Assets Increases
01/03/2011
- Major Asset Movements Muted, Bonds Continue to Stabilize
12/27/2010
- International REITs Outshine Among Dividend ETFs
12/25/2010
- TD Ameritrade Commission Free ETFs Report On 12/07/2010
12/07/2010
Retirement investing is an integral part of American personal finance. With $8.9 trillion parked in over 800 thousand retirement plans such as 401K, millions of Americans will increasingly rely on their 401K accounts to fund their future retirement needs. This article is part of a series of case studies we are conducting for various 401K plans. In this article, we will discuss how participants in TD Ameritrade Commission Free ETFs can achieve reasonable investment results using asset allocation strategies. We will also discuss how those portfolios are positioned in today’s market environment.
TD Ameritrade (Ticker: AMTD) offers 100+ commission free ETFs for its clients. The main restriction is that customers have to hold these ETFs for more than 30 days to make such trades eligible for commission free.
In this plan, the minimum holding period for each fund is set to be 1 month, which is equivalent to 30 days.
See the official TD Ameritrade offering for more details.
TD Ameritrade Commission Free ETFs's 401K plan consists of 101 funds. These funds enable participants to gain exposure to 6 major assets: US Equity , Foreign Equity , Commodity , Emerging Market Equity , REITs , Fixed Income . The list of minor asset classes covered:
Commodities Broad Basket: GSG , DBC
Conservative Allocation: AOK
Diversified Emerging Mkts: EEM , GMM , PXH , DEM , SCHE
Emerging Markets Bond: PCY
Equity: VTI , VT
Europe Stock: IEV , VGK , PEF , DEB
Foreign Large Blend: EFA , VEU , GWL , PFA
Foreign Large Growth: EFG
Foreign Large Value: EFV , PID , DWM
Foreign Small/mid Growth: IFSM , VSS , SCHC
Foreign Small/mid Value: SCZ
Global Real Estate: IFGL , RWX
High Yield Bond: HYG , JNK , PHB
Inflation-protected Bond: TIP
Intermediate Government: IEI , VGIT , ITE
Intermediate-term Bond: AGG , CIU , BIV , BND
Japan Stock: EWJ , JPP , PJO , DXJ
Large Blend: IVV , IYY , IWV , VTI , VV , SPY , DLN , RSP , SCHX
Large Growth: IVW , IWZ , JKE , VUG , ELG , QQQQ , RPG , SCHG
Large Value: IVE , IWW , JKF , VTV , ELV , PWV , RPV , SCHV
Latin America Stock: ILF , GML
Long Government: TLT , TLH , IEF , EDV , VGLT , TLO , PLW
Long-term Bond: CLY , LQD , BLV , VCLT
Mid-cap Blend: IJH , IWR , JKG , VO , MDY , EMM , PJG , DON , EZM , MVV
Mid-cap Growth: IJK , IWP , VOT , EMG , PWJ , RFG , UKW
Mid-cap Value: IJJ , IWS , JKI , VOE , EMV , PWP , RFV , UVU
Moderate Allocation: AOM
Multisector Bond: AGG , GBF , BND , LAG
Muni National Interm: ITM
Muni National Long: MUB , TFI , PZA , MLN
Muni National Short: SUB , SHM , PVI , SMB
Pacific/asia Ex-japan Stk: EPP , AAXJ , GMF , PAF , DND
Real Estate: IYR , ICF , VNQ
Short Government: SHY , SHV , VGSH , PLK , USY
Short-term Bond: CSJ , BSV , VCSH
Small Blend: IJR , IWM , JKJ , VB , DSC , PJM , DES , SAA , UWM , SCHA
Small Growth: IJT , IWO , JKK , VBK , DSG , PWT , RZG , UKK
Small Value: IJS , IWN , JKL , VBR , DSV , PWY , RZV , UVT
Specialty-real Estate: RWR , PSR , URE
World Allocation: AOR , AOA
World Bond: IGOV , BWX , WIP
World Stock: IOO , VT
As of Dec 3, 2010, this plan investment choice is rated as above average based on MyPlanIQ Plan Rating methodology that was designed to measure how effective a plan's available investment funds are . It has the following detailed ratings:
Diversification -- Rated as great (97%)
Fund Quality -- Rated as below average (21%)
Portfolio Building -- Rated as great (87%)
Overall Rating: above average (70%)The chart and table below show the historical performance of moderate model portfolios employing strategic and tactical asset allocation strategies ( SAA and TAA , both provided by MyPlanIQ). For comparison purpose, we also include the moderate model portfolios of a typical 6 asset SIB (Simpler Is Better) plan . This SIB plan has the following candidate index funds and their ETFs equivalent:
US Equity :( SPY or VTI )
Foreign Equity :( EFA or VEU )
Commodity :( DBC )
Emerging Market Equity :( EEM or VWO )
REITs :( IYR or VNQ or ICF )
Fixed Income :( AGG or BND )
Performance chart (as of Dec 3, 2010)Performance table (as of Dec 3, 2010)
Portfolio Name 1Yr AR 1Yr Sharpe 3Yr AR 3Yr Sharpe 5Yr AR 5Yr Sharpe TD Ameritrade Commission Free ETFs Tactical Asset Allocation Moderate 9% 68% 12% 78% 18% 115% TD Ameritrade Commission Free ETFs Strategic Asset Allocation Moderate 8% 71% -1% -8% 7% 36% Six Core Asset ETFs Tactical Asset Allocation Moderate 10% 67% 9% 69% 16% 105% Six Core Asset ETFs Strategic Asset Allocation Moderate 11% 87% 3% 12% 8% 37% Currently, asset classes in US Equity ( SPY , VTI ) and Emerging Market Equity ( EEM , VWO ) are doing relatively well. These asset classes are available to TD Ameritrade Commission Free ETFs participants.
To summarize, TD Ameritrade Commission Free ETFs plan participants can achieve reasonable investment returns by adopting asset allocation strategies that are tailored to their risk profiles. Currently, the tactical asset allocation strategy indicates overweighing on US Equity and Emerging Market Equity funds.
Disclosure:Symbols: , SPY , VTI , EFA , VEU , EEM , VWO , IYR , VNQ , ICF , AGG , BND , DBC , VT , HYG , JNK , PHB , AOM , AOK , CIU , BIV , ITM , SUB , SHM , PVI , SMB , AOR , AOA , MUB , TFI , PZA , MLN , EFG , GWL , PFA , IVE , IWW , JKF , VTV , ELV , PWV , RPV , SCHV , SCZ , EFV , PID , DWM , IFGL , RWX , IGOV , BWX , WIP , RWR , PSR , URE , IVV , IYY , IWV , VV , DLN , RSP , SCHX , IOO , SHY , SHV , VGSH , PLK , USY , TLT , TLH , IEF , EDV , VGLT , TLO , PLW , IEV , VGK , PEF , DEB , IVW , IWZ , JKE , VUG , ELG , QQQQ , RPG , SCHG , IJJ , IWS , JKI , VOE , EMV , PWP , RFV , UVU , IJH , IWR , JKG , VO , MDY , EMM , PJG , DON , EZM , MVV , IFSM , VSS , SCHC , IJS , IWN , JKL , VBR , DSV , PWY , RZV , UVT , IJR , IWM , JKJ , VB , DSC , PJM , DES , SAA , UWM , SCHA , GMM , PXH , DEM , SCHE , CLY , LQD , BLV , VCLT , GBF , LAG , PCY , CSJ , BSV , VCSH , IEI , VGIT , ITE , IJK , IWP , VOT , EMG , PWJ , RFG , UKW , ILF , GML , IJT , IWO , JKK , VBK , DSG , PWT , RZG , UKK , TIP , EPP , AAXJ , GMF , PAF , DND , EWJ , JPP , PJO , DXJ , GSG
- Vanguard-VA-Clone Report On 12/07/2010
12/07/2010