 |
Vanguard ETF: |  |
7.4%* |
|
Diversified Core: | |
8.1%* |
|
Six Core Asset ETFs: | |
7.3%* |
Articles on MMM
- Dividend Stock ETFs vs. Dividend Stock Mutual Funds
07/21/2011
When it comes to dividend stock investing for a retirement portfolio, investors have the following three ways:
- Invest in dividend stocks directly.
- Invest in dividend stock ETFs such as Vanguard Dividend Appreciation (VIG)
- Invest in dividend stock mutual funds
In an article titled as Top Dividend Funds Trounce S&P 500 published on thestreet.com, the authors picked the following actively managed dividend mutual funds:
- Frost Dividend Value (FADVX)
- BlackRock Equity Dividend(MDDVX)
- Columbia Dividend Income(LBSAX)
- RiverSource Dividend Opportunity(INUTX)
The following shows the performance comparision among these four mutual funds and Vanguard Dividend Appreciation ETF (VIG)
Portfolio Performance Comparison
Portfolio/Fund Name 1Yr AR 1Yr Sharpe 3Yr AR 3Yr Sharpe 5Yr AR 5Yr Sharpe FRDAX 25% 209% 6% 32% 4% 14% INUTX 25% 189% 8% 27% 5% 14% LBSAX 20% 150% 4% 22% 4% 16% MDDVX 23% 183% 3% 10% 4% 15% VIG 27% 218% 7% 29% 6% 22% From the above table and chart, it is clear that the low cost Vanguard VIG beats all of the four actively managed mutual funds by a big margin in the 1 and 5 years. This outperformance can be further seen here for a longer period.
As of 6/30/2011, the top ten holdings of VIG are
Rank Holdings 1 McDonald's Corp (MCD) 2 Chevron Corp (CVX) 3 ConocoPhillips (COP) 4 PepsiCo Inc/NC (PEP) 5 Coca-Cola Co/The (KO) 6 United Technologies Corp (UTX) 7 International Business Machines Corp (IBM) 8 Exxon Mobil Corp (XOM) 9 Procter & Gamble Co/The (PG) 10 3M Co (MMM) The top ten holdings account for 40.5% of the total assets held.
Since the fund has very low turn over rate (about 15%), the top holdings are excellent candidates for stock investors.
For active stock investors, it is also of intersts to look at the following comparison between VIG and diversified dividend paying ETF portfolios that use stock and REIT ETFs.
Portfolio Performance Comparison
Portfolio/Fund Name 1Yr AR 1Yr Sharpe 3Yr AR 3Yr Sharpe 5Yr AR 5Yr Sharpe Retirement Income ETFs Strategic Asset Allocation Risk Profile 0 23% 141% 7% 26% 6% 20% Retirement Income ETFs Tactical Asset Allocation Risk Profile 0 21% 127% 17% 88% 16% 76% VIG 27% 218% 7% 29% 6% 22% For longer time comparison, refer here.
The takeaway from this is that when it comes to dividend stock fund investing, using low cost ETFs is a good approach. Furthermore, active stock investors can benefit from the top stock holdings of low turn over funds.
Symbols: MCD, CVX, SPX, COP, PEP, KO, UTX, IBM, PG, XOM, MMM, Dividend Stocks, Retirement Investing
- SmartMoney Magazine Best Idea Portfolio Compared with a Diversified ETF Portfolio
04/13/2011
SmartMoney magazine published its annual best stock ideas in the February issue titled Where to Invest in 2011. We look at a portfolio that consists of the 12 stocks suggested in the article and compare this with an ETF portfolio.
We construct the portfolio "P SmartMoney Magazine Where to Invest 2011 12 Stocks Since 2011" that had equal weights to each of 12 stocks on 12/31/2010. The following is the list of stocks recommended by SmartMoney Magazine and their weightings on 4/8/2011:
Asset Fund in this portfolio Price Percentage Asset1 LOW (Lowe's Companies Inc.) 26.82 6.33% Asset1 TJX (The TJX Companies, Inc.) 50.7 13.33% Asset1 YUM (Yum! Brands Inc.) 49.58 10.98% Asset1 CMCSA (Comcast Corporation) 24.68 6.35% Asset1 RSG (Republic Services) 29.91 7.08% Asset1 PEP (PepsiCo Inc) 65.73 7.36% Asset1 CSCO (Cisco Systems Inc) 17.65 4.57% Asset1 GOOG (Google Inc) 578.16 7.97% Asset1 ORCL (Oracle Corp.) 33.54 12.29% Asset1 UTX (United Technologies) 84.81 8.66% Asset1 MMM (3M Company) 93.22 7.79% Asset1 UPS (United Parcel Serv) 73.25 7.29% We further construct a portfolio P SmartMoney Magazine Where to Invest 2011 12 Stocks that was started on 1/2/2006.
Buying individual stocks and managing a portfolio with a dozen of stocks is not a small feat: one has to constantly monitor stocks in the portfolio and buy/sell them if it is necessary (such as a fundamental event for a company indicates this company is no longer satisfied with the criteria, or a stock becomes too expensive, or just simply because there is a better more compelling stock available, etc.). In fact, various studies have shown that most professional mutual funds can not even beat a stock index.
On the other hand, an investor can choose a simpler and safer portfolio strategy: asset allocation, especially tactical asset allocation strategy by investing in ETFs or mutual funds. In the case of a tactical asset allocation strategy, it dynamically adjusts the weights of assets represented by ETFs. For example, MyPlanIQ's Tactical Asset Allocation (TAA) strategy adjusts exposure to various assets based on price momentum as well as risk parameters (such as volatility and drawdown).
The following is the list of six assets that represent the major markets:
Asset Class Ticker Name LARGE BLEND VTI Vanguard Total Stock Market ETF Foreign Large Blend VEU Vanguard FTSE All-World ex-US ETF DIVERSIFIED EMERGING MKTS VWO Vanguard Emerging Markets Stock ETF REAL ESTATE VNQ Vanguard REIT Index ETF COMMODITIES BROAD BASKET DBC PowerShares DB Commodity Idx Trking Fund Intermediate-Term Bond BND Vanguard Total Bond Market ETF Other than the fixed income fund (BND), all other five assets are considered as risk assets.
The following compares the performance between P SmartMoney Magazine Where to Invest 2011 12 Stocks and a portfolio with risk profile 0 (i.e. can have 100% invested in the risk assets) Six Core Asset ETF Benchmark TAA Risk Profile 0.
Portfolio Performance Comparison
Portfolio Name 1Yr AR 1Yr Sharpe 3Yr AR 3Yr Sharpe 5Yr AR 5Yr Sharpe P SmartMoney Magazine Where to Invest 2011 12 Stocks 13% 75% 8% 28% 6% 20% Six Core Asset ETF Benchmark TAA Risk Profile 0 19% 91% 16% 81% 20% 95% The following chart illustrates the performance comparison:
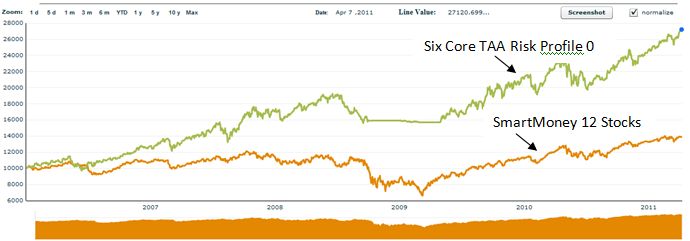
We make the following observations:
- The SmartMoney 12 stocks were recommended in Februrary 2011. The portfolio P SmartMoney Magazine Where to Invest 2011 12 Stocks was started on 1/2/2006. It is not exactly a fair comparison: most likely, these stocks were recommended based on their past performance and thus, the portfolio's performance could be more over-estimated.
- It is not exactly fair to compare an U.S. stock portfolio with a diversified portfolio that can invest in foreign stocks, emerging market stocks, REITs and even commodities. One reason behind this is that for most individual investors, they tend to focus on only domestic stocks. We will have a follow up article to compare this portfolio with an U.S. stock ETF portfolio.
- The above illustrates that there are simpler and better way to invest other than picking individual stocks. This is applicable to most average investors. Nevertheless, we acknowledge that few investors do have the possibility to achieve high returns with their systematic method and great insights. It is just for many average investors, they do not have time, means and discipline to do so. This is reflected that majority of professional investors under perform against a stock index such as S&P 500 (SPY).
Symbols: VTI, VEU, VNQ, VWO, DBC, BND, LOW, TJX, YUM, CMCSA, RSG, PEP, CSCO, GOOG, ORCL, UTX, MMM, UPS, EEM