|
Vanguard ETF: |  |
7.4%* |
|
Diversified Core: | |
8.1%* |
|
Six Core Asset ETFs: | |
7.3%* |
Articles on IDV
- Portfolio Management: Best of Fixed Income Managers vs. Retirement Income ETFs
09/08/2011
Two defensive investment strategies useful in current stressful times are compared. The first is based on selecting the best bond fund every month or every quarter from a list of bond funds managed by Morningstar's 'Manager of the Year' P Bond Funds Momentum Based on Upgrading Fixed Income Managers of the Year`s Funds Monthly. These funds include PTTRX, TGLMX, WATFX, MWTRX, LSBDX, DODIX, FPNIX.
The second is Retirement Income ETFs that consists of a list of candidate dividend stock and bond ETFs including DVY, EMB, HYG, ICF, IDV, TIP, VIG, VWO.
The conclusion: the Fixed Income Managers of the Year is solid and has lower volatility, a good defensive strategy one should consider. Both of them are better alternatives than a broad based index such as S&P 500 (SPX) or total bond market index (AGG)
Read more from our SeekingAlpha's article:
Defensive Strategies In Stressful Times: The Best Of Fixed Income
Symbols: SPX, DVY, EMB, HYG, ICF, IDV, TIP, VIG, VWO, PTTRX, TGLMX, WATFX, MWTRX, LSBDX, DODIX, FPNIX, Retirement Investing, Dividend Stock, Retirement Income, Portfolio Management
- Foreign Large Cap Equities Deliver Strong Returns Among Dividend Stock ETFs
05/04/2011
Foreign Large Cap Equity ETFs allow investors to diversify their portfolios by gaining exposure large stocks in developed economies across the globe. These ETFs track equities from nations like Japan, the UK, and Germany, among many others. These ETFs invest primarily in stocks with market caps in the top 70% of their respective markets.
Among Dividend Stock ETFs (see table), those that track Foreign Large Cap Equities performed very well in the past week, continuing their string performance over the past 52 weeks.. The iShares Dow Jones International Select Dividend ETF (IDV) returned 2.81% in the past week and over 28% in the past 52 weeks. Also performing well among Dividend Stock ETFs was the iShares MSCI EAFE Index ETF (EFA), which gained 2.69% in the last week and almost 18% during the past year.
Top Dividend Stock ETF Trends
4/29/2011
ETF Name Symbol 1 Week 4 Weeks SPDR DJ Wilshire Intl Real Estate RWX 2.98% 5.22% iShares Dow Jones Intl Select Div Idx IDV 2.81% 6.02% iShares MSCI EAFE Index EFA 2.69% 4.90% iShares Dow Jones US Real Estate IYR 2.62% 4.78% First Trust Value Line Dividend Index FVD 1.93% 3.15% SPDR S&P 500 SPY 1.93% 2.18% iShares Dow Jones Select Dividend Index DVY 1.89% 2.32% Vanguard High Dividend Yield Indx VYM 1.84% 3.27% PowerShares Intl Dividend Achievers PID 1.81% 4.28% PowerShares HighYield Dividend Achievers PEY 1.73% 1.78% The growth of these ETFs has followed an upward trend in the overall equity market in recent periods. As a higher percentage of the world's equity market capitalization continues to shift away from the United States, Foreign Large Cap Equities will continue to bring strong returns to investors.
Foreign Large Cap Equities
04/29/2011Description Symbol 1 Yr 3 Yr 5 Yr Avg. Volume(K) 1 Yr Sharpe iShares MSCI EAFE Index EFA 16.26% -3.93% 0.58% 17,665 68.32% Vanguard MSCI EAFE ETF VEA 21.49% -0.87% NA 2,135 88.16% Schwab International Equity SCHF 19.65% NA NA 180 86.62% iShares Dow Jones Intl Select IDV 26.81% 1.73% NA 156 107.04% iShares MSCI EAFE Value Index EFV 14.36% -4.8% -1.08% 133 55.66% PowerShares Intl Dividend Achievers PID 20.98% -1.56% 2.87% 121 112.83% iShares MSCI EAFE Growth Index EFG 19.53% -2.71% 1.55% 84 86.67% PowerShares DWA Dev Mkts Techn PIZ 22.65% -0.49% NA 115 93.38% In addition to the ETFs mentioned above, others in the Foreign Large Cap sector have shown strong growth in recent periods. The PowerShares DWA Developed Markets Technical ETF has returned 22.65% in the past year and the Vanguard MSCI EAFE ETF (VEA) gained 21.49% during the same period. These strong gains have helped to offset the large valuation declines experience during the recent financial crisis.
While high equity valuations may trigger a market retraction in coming periods, Foreign Large Cap Equity ETFs should remain a substantial part of any well-diversified portfolio.
Symbols: EFA, VEA, SCHF, IDV, EFV, PID, EFG, PIZ, RWX, IDV, EFA, IYR, FVD, SPY, DVY, VYM, PEY
Disclosure: MyPlanIQ does not have any business relationship with the company or companies mentioned in this article. It does not set up their retirement plans. The performance data of portfolios mentioned above are obtained through historical simulation and are hypothetical.
- Tactically Manage An Income Producing Portfolio With Commodity Exposure
03/25/2011
Coming out of the great recession, governments around the world have adopted loose monetary policies to prop up the economies. These include U.S. central bank's QE2 (Quantitative Easing act 2) and Euro Zone's bailout of troubling peripheral countries like Greece. The current natural disasters in Japan and other countries can only add more demand for the stimulus. These policies resulted in commodity hoarding, especially in material hungry emerging economies such as China.
It is critical to have anti-inflation anti-currency devaluation component. In this article, we explore the feasibility of adding commodity exposure to an income producing portfolio. Commodity ETFs are effective tools to cope with the current situations. In a portfolio that is designed to preserve capital for retirement needs. However, because of volatile and somewhat dangerous nature of commodites, one needs to actively manage such a portfolio by adopting tactical asset allocation strategies.
Income producing ETFs such as high yield stock ETFs and bond ETFs can be used to build a lower risk portfolio for retirement income producing purpose. We study the two plans: one is without commodity exposure and the other one with the exposure.Retirement Income ETFs with Commodities plan is an extension to Retirement Income ETFs: adding extra commodity asset class with PowerShares DB Commodity Index (DBC) and GreenHaven Continuous Commodity (GCC). This plan consists of 37 funds. These funds enable investors to gain exposure to 6 major assets: US Equity, Commodity, Foreign Equity, Emerging Market Equity, REITs, Fixed Income. Compared with Retirement Income ETFs, this plan has two additional ETFs that represent the extra commodity asset class.
The following is the list of the candidate ETFs in the Retirement Income ETFs with Commodities:
The list of minor asset classes covered by Retirement Income ETFs with Commodities Commodities Broad Basket: DBC, GCC
Diversified Emerging Mkts: EEM, VWO, DEM
Emerging Markets Bond: EMB, PCY
Foreign Large Value: PID, IDV
Global Real Estate: RWX
High Yield Bond: HYG
Inflation-protected Bond: TIP
Intermediate Government: IEI
Intermediate-term Bond: CIU, CORP, MBB
Large Blend: VIG
Large Value: DVY, SDY, VYM, FVD
Long Government: IEF, TLT
Long-term Bond: LQD, VCLT
Mid-cap Value: PEY
Miscellaneous Sector: PFF
Muni National Long: MUB
Muni Short: SHM
Real Estate: IYR, ICF, VNQ
Short Government: SHY
Short-term Bond: CSJ, VCSH
World Bond: BWX, WIPAs of Mar 24, 2011, Retirement Income ETFs with Commodities investment choice is rated as and Retirement Income ETFs investment choice is rated as average based on MyPlanIQ Plan Rating methodology that was designed to measure how effective a plan's available investment funds are. It has the following detailed ratings:
The chart and table below show the historical performance of moderate model portfolios employing strategic and tactical asset allocation strategies (SAA and TAA , both provided by MyPlanIQ).
Performance chart (as of Mar 24, 2011)
Performance table (as of Mar 24, 2011)
Portfolio Name 1Yr AR 1Yr Sharpe 3Yr AR 3Yr Sharpe 5Yr AR 5Yr Sharpe Retirement Income ETFs with Commodities Tactical Asset Allocation Moderate 10% 79% 8% 68% 11% 83% Retirement Income ETFs with Commodities Strategic Asset Allocation Moderate 11% 97% 1% 4% 4% 20% Retirement Income ETFs Tactical Asset Allocation Moderate 7% 40% 8% 65% 10% 62% Retirement Income ETFs Strategic Asset Allocation Moderate 11% 69% 3% 14% 5% 17% Discussions:
1. Commodity ETFs are volatile. In fact, PowerShare DB Commodity Index ETF (DBC) lost 32% in 2008 while iShares S&P GSCI Commodity Index (GSG) lost a whopping 46% in the same year.
2. Simply adding commodity ETFs to a strategic asset allocation portfolio (buy and hold with regular rebalancing) did not improve the returns in the past five years. This is again due to the big loss incurred in commodtiy ETFs.
3. Adding commodity ETFs as fund candidates in a tactical asset allocation portfolio, however, can improve returns. In the past five years, Retirement Income ETFs with Commodities Tactical Asset Allocation Moderate had extra 1% annualized return over Retirement Income ETFs Tactical Asset Allocation Moderate.
In conclusions. commodity ETFs are effective tools to cope with the current situations. In a portfolio that is designed to preserve capital for retirement needs. However, because of volatile and somewhat dangerous nature of commodites, one needs to actively manage such a portfolio by adopting tactical asset allocation strategies.
Disclosure:MyPlanIQ does not have any business relationship with the company or companies mentioned in this article. It does not set up their retirement plans. The performance data of portfolios mentioned above are obtained through historical simulation and are hypothetical.
Symbols:DBC,GCC,GSG,EEM,VWO,DEM,EMB,PCY,PID,IDV,RWX,HYG,TIP,WIP,IEI,CIU,CORP,MBB,VIG, DVY,SDY,VYM,FVD,IEF,TLT,LQD,VCLT,PEY,PFF,MUB,SHM,IYR,ICF,VNQ,SHY,CSJ,VCSH,BWX,
Exchange Tickers: (DBC),(GCC),(GSG),(EEM),(VWO),(DEM),(EMB),(PCY),(PID),(IDV),(RWX),(HYG),(TIP),(WIP),(IEI),(CIU),(CORP),(MBB),(VIG),(DVY),(SDY),(VYM),(FVD),(IEF),(TLT),(LQD),(VCLT),(PEY),(PFF),(MUB),(SHM),(IYR),( ICF),(VNQ),(SHY),(CSJ),(VCSH),(BWX)
- Dividend Stock ETFs Somewhat Defensive But Not Enough to Withstand Market Stress
03/17/2011
The week ending on last Wednesday was not easy to investors: the biggest events in the week are the Japanese biggest earthquake in the last 20 years and its increasingly dangerous nuclear reactors meltdown (still unfolding). In the domestic economic side, the housing starts (home construction) in February plunged to the lowest level in almost a year, indicating the housing situation is yet to stabilize.
The performance of dividend stock ETFs for the week ending on Wednesday (3/16/2011) varied. Dividend ETFs clearly showed their defensive natures: for U.S. equity, the broadbase S&P 500 (SPY) dropped 4.7%, while SPDR S&P dividend (SDY) dropped 4.1%, iShares Dow Jones Dividend Select (DVY) dropped 4.2%. In fact, all of U.S. stock dividend ETFs fared better than S&P 500. A standout is the iShares S&P U.S. Preferred ETF (PFF), losing only 0.6%. Similarly, Powershares Intl Dividend Achievers (PID) did much better than broadbase MSCI index (EFA): -5.3% vs. -9.1%. For more detailed performance, please refer to here.
The following table shows the trend scores of dividend ETFs. A noticeable jump is for the Preferred ETF (PFF): it now rose from the last place to the middle in the table, indicating a clear defensive nature of the preferred stocks.Assets Class Symbols 03/16
Trend
Score03/09
Trend
ScoreDirection iShares Dow Jones US Real Estate IYR 4.65% 9.61% v Vanguard Dividend Appreciation VIG 2.98% 9.2% v SPDR S&P 500 SPY 2.79% 9.41% v Vanguard High Dividend Yield Indx VYM 2.7% 9.15% v iShares Dow Jones Select Dividend Index DVY 2.43% 8.42% v iShares S&P U.S. Preferred Stock Index PFF 2.32% 3.38% v First Trust Value Line Dividend Index FVD 1.91% 8.22% v SPDR S&P Dividend SDY 1.74% 7.95% v WisdomTree Emerging Market Equity Income DEM 1.66% 8.12% v PowerShares Intl Dividend Achievers PID 1.01% 7.84% v PowerShares HighYield Dividend Achievers PEY 0.12% 7.11% v iShares MSCI Emerging Markets Index EEM -0.44% 6.3% v iShares Dow Jones Intl Select Div Idx IDV -0.92% 8.05% v SPDR DJ Wilshire Intl Real Estate RWX -1.47% 9.74% v iShares MSCI EAFE Index EFA -4.57% 6.48% v The trend score is defined as the average of 1,4,13,26 and 52 week total returns (including dividend reinvested).
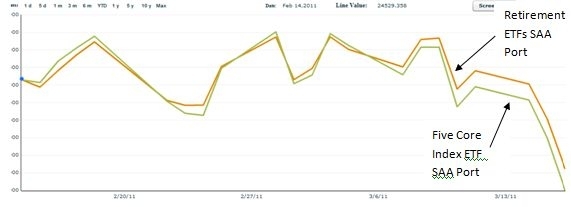
Portfolios that use dividend ETFs in place of broadbase stock index ETFs showed a slight advantage over a pure broadbase index ETFs based portfolios. For example, we introduced a retirement income ETF investment plan that uses dividend stock ETFs. The following chart shows the five day performance comparison between the Strategic Asset Allocation (SAA) moderate risk portfolio and a broadbased Five Core Asset ETF (SAA) moderate risk portfolio:
In fact, the dividend ETF plan's Strategic Asset Allocation (SAA) moderate risk portfolio had a big 28% drop in 2008. That shows one can not simply rely on dividend paying ETFs to avoid big loss.
If a more tactive Tactical Asset Allocation (TAA) strategy is used for these dividend ETFs, performance can be improved dramatically:
Portfolio Performance Comparison
Portfolio Name 1Yr AR 1Yr Sharpe 3Yr AR 3Yr Sharpe 5Yr AR 5Yr Sharpe Retirement Income ETFs Strategic Asset Allocation Moderate 8% 63% 4% 17% 4% 16% Retirement Income ETFs Tactical Asset Allocation Moderate 5% 60% 8% 72% 9% 68%
The takeaway is that dividend stock ETFs are more defensive in nature. However, to achieve greater risk reduction, a more active tactical asset allocation strategy should be employed.
Symbols: RWX,SPY,IYR,VIG,IDV,VYM,EEM,PID,EFA,FVD,DVY,PEY,SDY,PFF ,
Symbols: (NASDAQ: RWX), (NASDAQ: SPY), (NASDAQ: IYR), (NASDAQ: VIG), (NASDAQ: IDV), (NASDAQ: VYM), (NASDAQ: EEM), (NASDAQ: PID), (NASDAQ: EFA), (NASDAQ: FVD), (NASDAQ: DVY), (NASDAQ: PEY), (NASDAQ: SDY), (NASDAQ: PFF)Disclosure:
MyPlanIQ does not have any business relationship with the company or companies mentioned in this article. It does not set up their retirement plans. The performance data of portfolios mentioned above are obtained through historical simulation and are hypothetical.
- Riding High with Global Economy, International REITs Offer Currency and Inflation Hedge
03/10/2011
- Dividend ETFs: Public REITs Offer Good Value While Economy Recovers
03/04/2011
- Replacing VEA and EFV with PID, PIZ Boosts Morningstar Clone Across the Board
03/01/2011
- Dividend Stock ETFs All Dropped, But Showing Defensive
02/24/2011
- Yield Quest Turns from Bonds to High Yield Stocks
12/16/2010
- ETF's for Income Nov 29
11/29/2010
- ETF's for Income Rebound Well
11/23/2010
- High Dividend Stock ETFs for Income Producing Portfolios
11/12/2010
- Retirement Income Portfolio Building Using ETFs and Asset Allocation Strategies
11/12/2010