 |
Vanguard ETF: |  |
7.4%* |
|
Diversified Core: | |
8.1%* |
|
Six Core Asset ETFs: | |
7.3%* |
Articles on FXI
- Country ETFs: Germany leads the way up this week
04/30/2011
A retirement portfolio that includes both foreign and domestic investments can provide for more diversification, with more opportunities for growth. This article will focus on country specific ETFs, and how they have been performing.
International equity ETFs are available in several types. These include specific developed countries, specific emerging countries, specific frontier countries, as well as ETFs that hold equities from multiple countries and in several sectors and industries. The ETF provider iShares®, for several years, has been one of the leaders in Country ETFs, however there are several other ETF providers that have been offering an interesting line up of investments. Another interesting provider is Van Eck, with their Russia (RSX) ETF.
We follow twenty three Country ETFs, and their performance over the past year is in the following table: (You can view this table here also- Global Stocks Trend). I have added the Total US Stock Market ETF (VTI) for comparison (in bold italics), - interesting that it ranks right about in the middle in terms of Trend Score.
As the Dollar sells off and the Euro rallies this week, Germany (EWG), up over 5%, ranks at the top of the list in Trend Score. You can see from the list that some of the countries that are performing well, year over year, are resource rich. Australia, South Africa, Canada and Russia, are major producers of minerals and mining, and energy.
The countries that are outperforming the US Stock Market are probably doing better for several reasons. One reason is that the US is exporting inflation. Another is higher economic growth rates in those countries.
Global Stocks Trend, ranked by 'Trend Score' - as of Friday April 29
Description
Symbol
1Week
4Weeks
13Weeks
26Weeks
52Weeks
Trend Score
Germany
EWG
5.07%
9.10%
15.12%
20.77%
34.55%
16.92%
South Korea
EWY
0.89%
4.91%
12.40%
27.17%
33.40%
15.76%
South Africa
EZA
3.61%
3.60%
18.63%
15.98%
31.47%
14.66%
Switzerland
EWL
3.72%
10.04%
12.39%
18.41%
27.05%
14.32%
Belgium
EWK
4.42%
9.24%
17.56%
12.14%
26.80%
14.03%
Australia
EWA
0.82%
4.98%
15.06%
18.47%
23.67%
12.60%
France
EWQ
4.41%
6.09%
12.93%
15.03%
23.62%
12.41%
Italy
EWI
5.89%
7.70%
13.20%
13.19%
20.95%
12.18%
Taiwan
EWT
2.56%
5.96%
2.63%
17.35%
28.34%
11.37%
Spain
EWP
5.63%
6.76%
12.25%
9.92%
19.13%
10.74%
The Netherlands
EWN
3.45%
3.45%
12.31%
15.11%
19.23%
10.71%
United Kingdom
EWU
2.08%
5.29%
10.46%
13.21%
21.25%
10.46%
US Stocks
VTI
2.01%
2.40%
7.85%
18.72%
19.58%
10.11%
Canada
EWC
-0.41%
-0.68%
8.67%
17.77%
20.65%
9.20%
Russia
RSX
-0.63%
-3.20%
6.82%
20.65%
22.01%
9.13%
Austria
EWO
0.50%
1.18%
7.70%
13.96%
21.52%
8.97%
Malaysia
EWM
1.08%
0.47%
5.85%
8.51%
27.13%
8.61%
Mexico
EWW
0.88%
0.91%
6.95%
12.33%
21.93%
8.60%
Singapore
EWS
0.49%
5.17%
5.24%
8.40%
23.12%
8.48%
Hong Kong
EWH
-0.87%
1.47%
1.04%
4.32%
27.03%
6.60%
Brazil
EWZ
-1.12%
-1.89%
7.13%
4.12%
11.01%
3.85%
China
FXI
-2.50%
-0.62%
7.57%
0.93%
12.41%
3.56%
Japan
EWJ
3.03%
2.23%
-3.57%
5.81%
2.04%
1.91%
India
INP
-1.60%
-1.90%
9.64%
-6.55%
8.05%
1.53%
The trend score is defined as the average of 1, 4, 13, 26 and 52 week total returns (including dividend reinvested).
Another benefit of these Country ETFs is currency diversification. Owning these ETFs is like owning a basket of currencies from outside the US.
These ETFs are on my retirement account watch list this year.
Disclosure: MyPlanIQ does not have any business relationship with the company or companies mentioned in this article. It does not set up their retirement plans. The performance data of portfolios mentioned above are obtained through historical simulation and are hypothetical.
Symbols: EWY, EWA, EWG, EZA, EWC, EWT, EWL, RSX, EWK, EWS, EWO, SPY, EWU, EWM, EWW, EWQ, EWH, EWN, EWZ, FXI, EWI, EWP, INP, EWJ
- Country ETFs: South Korea leads the way up
04/29/2011
A retirement portfolio that includes both foreign and domestic investments can provide for more diversification, with more opportunities for growth. This article will focus on country specific ETFs, and how they have been performing.
International equity ETFs are available in several types. These include specific developed countries, specific emerging countries, specific frontier countries, as well as ETFs that hold equities from multiple countries and in several sectors and industries. The ETF provider iShares®, for several years, has been one of the leaders in Country ETFs, however there are several other ETF providers that have been offering an interesting line up of investments. Another interesting provider is Van Eck, with their Russia (RSX) ETF.
We follow twenty three Country ETFs, and their performance over the past year is in the following table: (You can view this table here also- Global Stocks Trend). I have added the SPDR S&P 500 ETF (SPY) for comparison (in bold italics), - interesting that it ranks right about in the middle in terms of performance over the past year.
as of 4/21
Description
Symbol
1week
4Weeks
13weeks
26weeks
52weeks
Trend Score
South Korea
EWY
4.32%
11.39%
9.73%
27.01%
30.66%
16.62%
Australia
EWA
2.49%
9.28%
13.71%
18.81%
17.94%
12.44%
Germany
EWG
2.09%
7.41%
11.25%
15.23%
25.01%
12.20%
South Africa
EZA
3.00%
5.96%
8.83%
10.94%
27.01%
11.15%
Canada
EWC
1.96%
1.59%
9.69%
19.41%
19.37%
10.41%
Taiwan
EWT
2.63%
5.91%
-0.26%
18.77%
24.05%
10.22%
Switzerland
EWL
3.03%
5.88%
10.63%
12.30%
18.23%
10.01%
Russia
RSX
1.97%
-0.41%
5.02%
21.74%
19.46%
9.56%
Belgium
EWK
1.84%
6.11%
13.18%
7.02%
16.37%
8.90%
Singapore
EWS
2.20%
7.31%
4.89%
7.33%
21.41%
8.63%
Austria
EWO
1.28%
2.01%
8.58%
12.54%
17.17%
8.32%
SPDR S&P 500
SPY
1.93%
2.18%
5.08%
15.71%
15.90%
8.16%
United Kingdom
EWU
2.02%
4.46%
7.40%
12.02%
14.39%
8.06%
Malaysia
EWM
1.02%
2.13%
0.75%
8.59%
25.98%
7.69%
Mexico
EWW
0.97%
3.73%
2.64%
13.44%
17.30%
7.62%
France
EWQ
1.35%
3.55%
8.93%
9.52%
13.21%
7.31%
Hong Kong
EWH
0.26%
5.45%
-1.06%
3.96%
23.57%
6.43%
The Netherlands
EWN
-0.43%
1.71%
9.07%
10.16%
10.95%
6.29%
Brazil
EWZ
2.75%
4.52%
3.63%
5.80%
10.39%
5.42%
China
FXI
1.80%
6.28%
6.33%
0.90%
11.63%
5.39%
Italy
EWI
0.05%
1.39%
7.03%
6.66%
6.36%
4.30%
Spain
EWP
-0.25%
0.81%
6.80%
3.96%
7.21%
3.71%
India
INP
-0.45%
5.98%
4.87%
-9.33%
7.54%
1.72%
Japan
EWJ
1.79%
-3.49%
-7.59%
2.18%
-0.96%
-1.61%
The trend score is defined as the average of 1, 4, 13, 26 and 52 week total returns (including dividend reinvested).
South Korea (EWY) at the top of the list, has been trending about double the (SPY).You can see from the list that some of top performing countries are resource rich. Australia, South Africa, Canada and Russia, are major producers of minerals and mining, and energy.
Another benefit of these Country ETFs is currency diversification. Owning these ETFs is like owning a basket of currencies from outside the US.
These ETFs are on my retirement account watch list this year.
Disclosure: MyPlanIQ does not have any business relationship with the company or companies mentioned in this article. It does not set up their retirement plans. The performance data of portfolios mentioned above are obtained through historical simulation and are hypothetical.
Exchange Tickers: (NYSE:EWY), (NYSE:EWA), (NYSE:EWG), (NYSE:EZA), (NYSE:EWC), (NYSE:EWT), (NYSE:EWL), (NYSE:RSX), (NYSE:EWK), (NYSE:EWS), (NYSE:EWO), (NYSE:SPY) ,(NYSE:EWU), (NYSE:EWM), (NYSE:EWW), (NYSE:EWQ), (NYSE:EWH), (NYSE:EWN), (NYSE:EWZ), (NYSE:FXI), (NYSE:EWI), (NYSE:EWP), (NYSE:INP), (NYSE:EWJ)
Symbols: EWY, EWA, EWG, EZA, EWC, EWT, EWL, RSX, EWK, EWS, EWO, SPY, EWU, EWM, EWW, EWQ, EWH, EWN, EWZ, FXI, EWI, EWP, INP, EWJ
- International Investing in Uncertain Times
04/22/2011
by Nanette Byrnes at Portfolioist.com
 Political turmoil in the Middle East and Africa, a natural and nuclear disaster in Japan, rekindling European debt crises: It’s easy to understand why investors may shy away from investing in foreign stocks these days.
They may be making a mistake.
Reluctant Global Investors
“There’s so much fear out there,” says Darleen Gilmore, founder of Austin Wealth Specialists, an investment advisor who likes clients to put a certain percent of their holdings into global markets. “I have to ease them into it.”
In a recent survey of global investors, Franklin Templeton found that U.S. investors buy the idea that good opportunities exist outside of the 50 states, but many don’t act on that belief. According to the firm’s writeup of the survey:
“When considering equities in particular, nearly three-quarters (73 percent) of U.S. respondents stated that the best opportunities will lie not only in the U.S. over the next 10 years. However, the survey showed that just 40 percent of Americans currently have investments outside the U.S.”
Why the disconnect?
Gilmore says that people who lost money in the markets in 2008 and 2009 or who have suffered from a period of unemployment, are hesitant to jump into investing outside of home terrain.
Building an International Portfolio Heavy on Emerging Markets and Agriculture To Beat Inflation
She works mainly with customers preparing for retirement or who have already retired, and though she doesn’t put a huge chunk of their money into emerging markets, she does like to see a slice of 10% or so in global funds. With faster economic growth coming outside the U.S., Gilmore sees this as one way to help clients beat inflation.
When building international exposure into her clients’ portfolios, Gilmore focuses on a few trends:
- Her focus is on emerging markets rather than developed markets outside the U.S.. First, US indexes like the S& P500 have companies with strong exposure to developed markets outside the U.S. already (Coca Cola (KO), McDonalds (MCD), etc.). Second, Europe is struggling with a growing list of sovereign debt crises, rising unemployment, and aging populations. Third, emerging markets are where the fast growth is likely to come from.
- She also puts a focus on agriculture, including meat. This is Gilmore’s bet on the rising middle class of India, China and other emerging nations, and their growing taste for a broader diet with far more protein.
- For balance, Gilmore includes some shorter-term fixed income investments. Those should help balance out performance, so her customers don’t get too nervous if things swing down for a while in the rest of the portfolio. “The reason people won’t hold an investment for some time is the volatility,” she explains. “If I can get them focused on the whole portfolio, then I can get them to be a little more patient.”
Gilmore is not a market timer, but she does advocate using a tactical asset allocation in which an investor makes some shifts from time to time based on the broader environment. She is not a fan of buy and hold, which she says most clients can’t really embrace. They become anxious to do something from time to time, and she sees opportunities to do so. “Investments change, portfolio managers change, new opportunities come about,” she notes. One example: Exchange Traded Funds (ETFs) and UCIs (which stands for “Undertakings for Collective Investment”), which she uses for most clients today. Their transparency, lower cost than mutual funds and the ability to trade and price them at any time, leave clients feeling more secure, she says.
Though it can take time for a client to become comfortable with global investing, Gilmore argues that without it, investors don’t stand a great chance of keeping up with inflation. For any investor near retirement, doing so is critical.
(photo: Tuppus)
Symbols: EEM, VWO, DBA, FXI, MOO
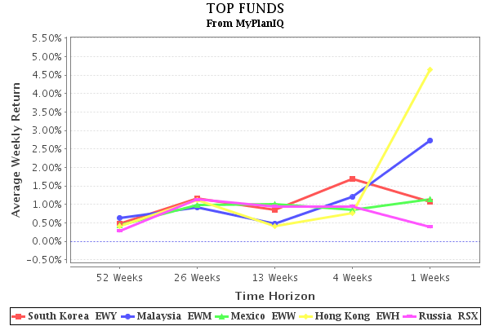
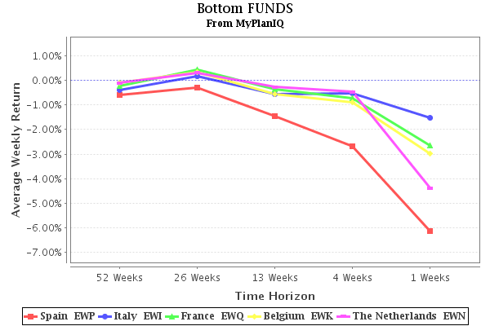
- Country ETFs Flat or Modestly Down While Spain Flounders
01/12/2011
Last week, indices around the globe showed declining trend scores with only a few countries showing a positive trend increase.
South Korea (EWY) remained at the top spot, albeit seeing its trend score lowered last week. The fundamentals of the South Korean economy continue to look strong. The trend was lowered mainly due to investor appetite for profit-taking.
Malaysia (EWM) jumped from sixth place to claim the second spot last week. Unlike most of its high growth ASEAN counterparts, the Malaysian equity market did not go up as much in 2010. The country’s initiatives to reform its banking sector and massive spending plan on infrastructure projects bodes well for a positive economic outlook this year.
Renewed concerns about European sovereign debt continued to drive Spain (EWP), Italy (EWI), and France (EWQ) lower. Uncertainties over potential sovereign defaults will likely to send more turbulence to the markets in the eurozone.
We will see if the volatilities will spill over to outside the eurozone -- this data can regularly be reviewed at the 360 Degree Market View.
Assets Class
Symbols
01/07
Trend
Score
12/31
Trend
Score
Direction
South Korea
14.68%
18.02%
v
Malaysia
14.1%
13.99%
^
Mexico
12.99%
14.94%
v
Hong Kong
12.67%
9.86%
^
Russia
12.13%
15.42%
v
South Africa
9.64%
18.0%
v
Taiwan
9.18%
16.58%
v
Singapore
7.83%
10.08%
v
Canada
7.59%
11.28%
v
Japan
6.93%
8.76%
v
Austria
5.66%
15.63%
v
United Kingdom
4.54%
8.25%
v
Switzerland
4.06%
10.66%
v
Germany
3.44%
7.92%
v
Australia
2.36%
10.79%
v
India
1.96%
9.83%
v
China
1.32%
2.11%
v
Brazil
1.27%
5.39%
v
The Netherlands
-1.31%
6.79%
v
Belgium
-2.03%
4.05%
v
France
-2.12%
4.06%
v
Italy
-5.43%
-0.82%
v
Spain
-14.88%
-5.58%
v
click to enlarge images
labels:investment,
Symbols:AGG,BND,CIU,CSJ,DBA,DBC,EEM,EFA,EWA,EWC,EWG,EWH,EWI,EWJ,EWK,EWL,EWM,EWN,EWO,EWP,EWQ,EWS,EWT,EWU,EWW,EWY,EWZ,EZA,FXI,GSG,HYG,ICF,IEF,INP,IWM,IYR,JNK,LQD,MBB,MDY,MUB,PHB,QQQQ,RSX,SHV,SHY,SPY,TLT,USO,VEU,VNQ,VWO,
- Country ETFs Flat While South Korea and South Africa Spike
01/06/2011
Last week, indices around the globe showed a more positive trend with only a few countries showing a negative trend.
South Korea sees a significant jump as its economy continues to look strong and is a major player in the non-BRIC growth economies. South Africa also continued with strong growth and is aligned with South Korea as a high growth emerging economy outside the BRIC club.
The balance of the other national economies were flat or modestly up as we rounded out the end of the year.
Spain continues to be a concern and it will likely take some time to work through the national debt concerns.
We will see if the upward trend continues early in 2011 -- this data can regularly be reviewed at the 360 Degree Market View.
Assets Class Symbols 12/31
Trend
Score12/24
Trend
ScoreDirection South Korea EWY 18.02% 13.68% ^ South Africa EZA 18.0% 15.93% ^ Taiwan EWT 16.58% 13.5% ^ Austria EWO 15.63% 12.26% ^ Russia RSX 15.42% 15.55% v Mexico EWW 14.94% 12.9% ^ Malaysia EWM 13.99% 11.11% ^ Canada EWC 11.28% 9.37% ^ Australia EWA 10.79% 9.33% ^ Switzerland EWL 10.66% 9.87% ^ Singapore EWS 10.08% 6.41% ^ Hong Kong EWH 9.86% 10.14% v India INP 9.83% 8.91% ^ Japan EWJ 8.76% 6.95% ^ United Kingdom EWU 8.25% 7.42% ^ Germany EWG 7.92% 8.63% v The Netherlands EWN 6.79% 3.66% ^ Brazil EWZ 5.39% 2.45% ^ France EWQ 4.06% 3.46% ^ Belgium EWK 4.05% 2.89% ^ China FXI 2.11% 0.62% ^ Italy EWI -0.82% -0.51% v Spain EWP -5.58% -5.74% ^ labels:investment,
Symbols:AGG,BND,CIU,CSJ,DBA,DBC,EEM,EFA,EWA,EWC,EWG,EWH,EWI,EWJ,EWK,EWL,EWM,EWN,EWO,EWP,EWQ,EWS,EWT,EWU,EWW,EWY,EWZ,EZA,FXI,GSG,HYG,ICF,IEF,INP,IWM,IYR,JNK,LQD,MBB,MDY,MUB,PHB,QQQQ,RSX,SHV,SHY,SPY,TLT,USO,VEU,VNQ,VWO,
- Country ETF Trends Largely Unchanged: Russia Shines, Spain Tumbles
12/29/2010
- Country ETFs Trend: Global Markets Remain Mixed, weighed by Korean Tensions and Europe Debt Concerns
12/22/2010
- Global Markets Largely Flat
12/14/2010
- Global Market Sentiment Improves
12/08/2010
- Countries Nov 29
11/30/2010
- Most Countries Rebound Some Do Not
11/23/2010
- Countries All Drop -- India significantly, Japan only a little
11/16/2010
- International ETF's Give Insight on Global Economies
11/10/2010
